
Figure 2.
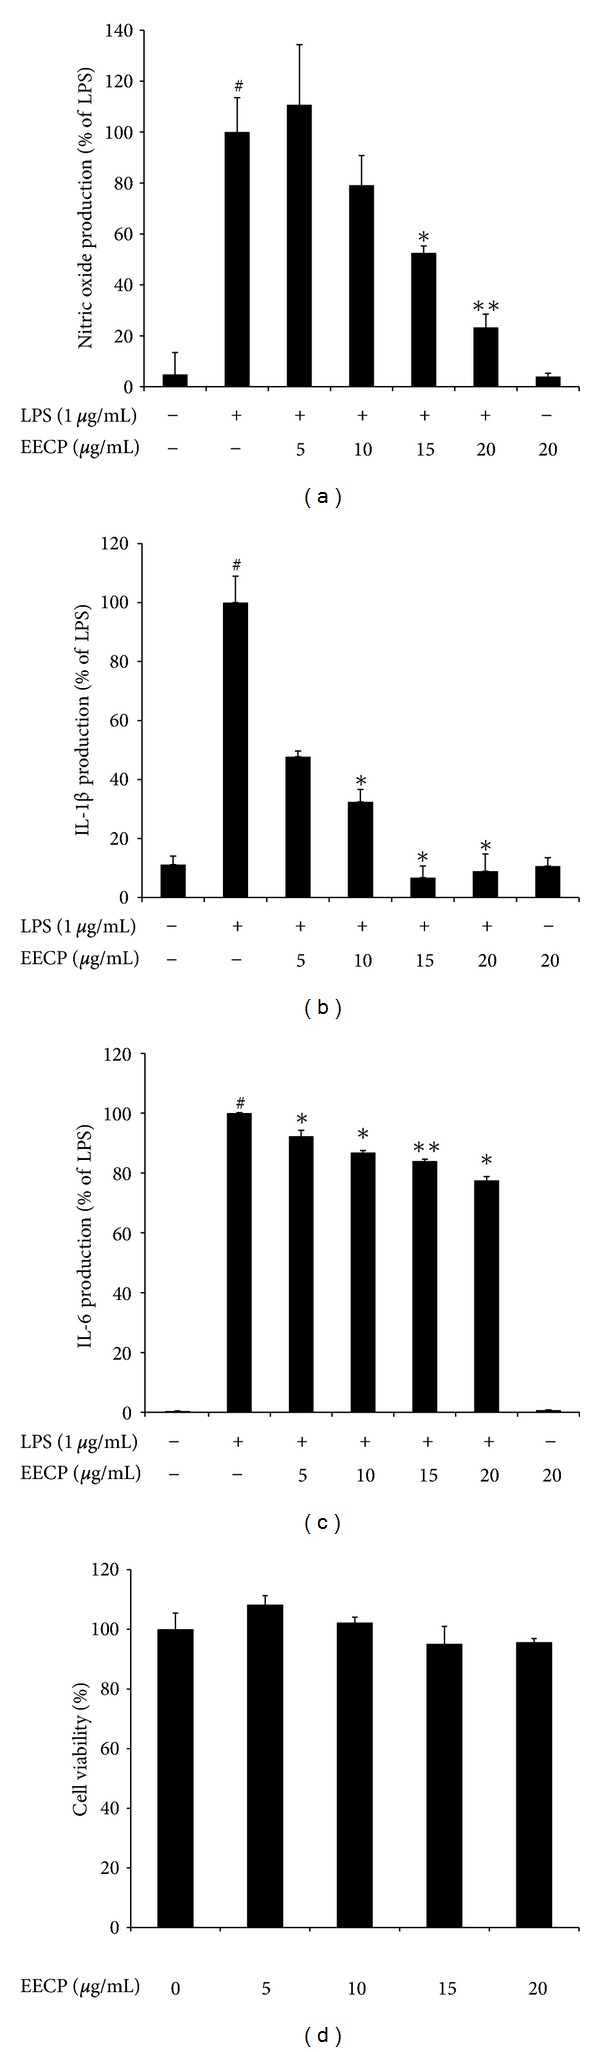
Effects of EECP on LPS-induced NO, IL-1β, and IL-6 production and cell viability in RAW 264.7 cells. (a–c) Cells were pretreated with/without indicated concentrations of EECP for 1 h then stimulated with LPS (1 μg/mL) for 18 h. Control values were obtained in the absence of LPS or EECP. The values are presented as percentages of NO (a), IL-1β (b), and IL-6 (c) comparing with LPS-treated cells, respectively. (d) RAW 264.7 cells were treated with indicated concentrations of EECP (0–20 μg/mL) for 24 h, and the results are expressed by percentages of surviving cells over control cells (no addition of EECP) using MTT assays. The data are the means ± SDs for three independent experiments. Individual groups were compared using Student's t-test (*P < 0.05, **P < 0.01 compared with the LPS group; # P < 0.05 compared with untreated group).