
Figure 4. Summary of neuronal responses.
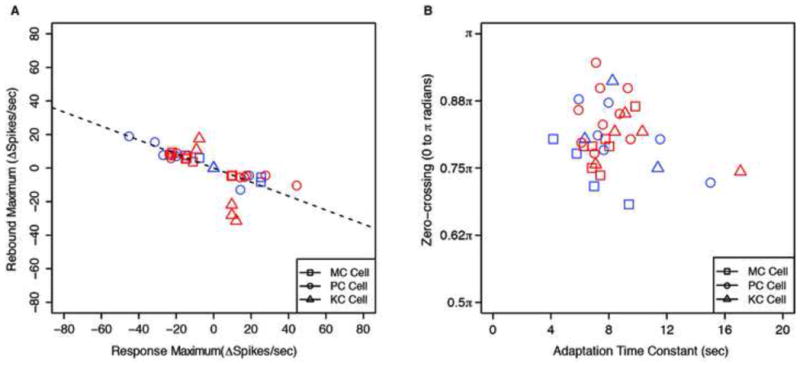
(a) Maximum rebound response of each cell versus its maximum response to the stimulus (increments and decrements of spikes/sec). The best fitting regression line through (0,0) has a slope of −0.42 (R2=0.54). (b) The phase of zero-crossing (0 to π radians) of each cell versus its time constant for subtractive adaptation (seconds). Different symbols denote different classes of RGCs. In both figures, there are two points per cell, one for each polarity of the stimulus modulation, except for a few cells for which we could only record one polarity reliably. Red symbols denote ON cells, and Blue OFF cells.