Figure 2.

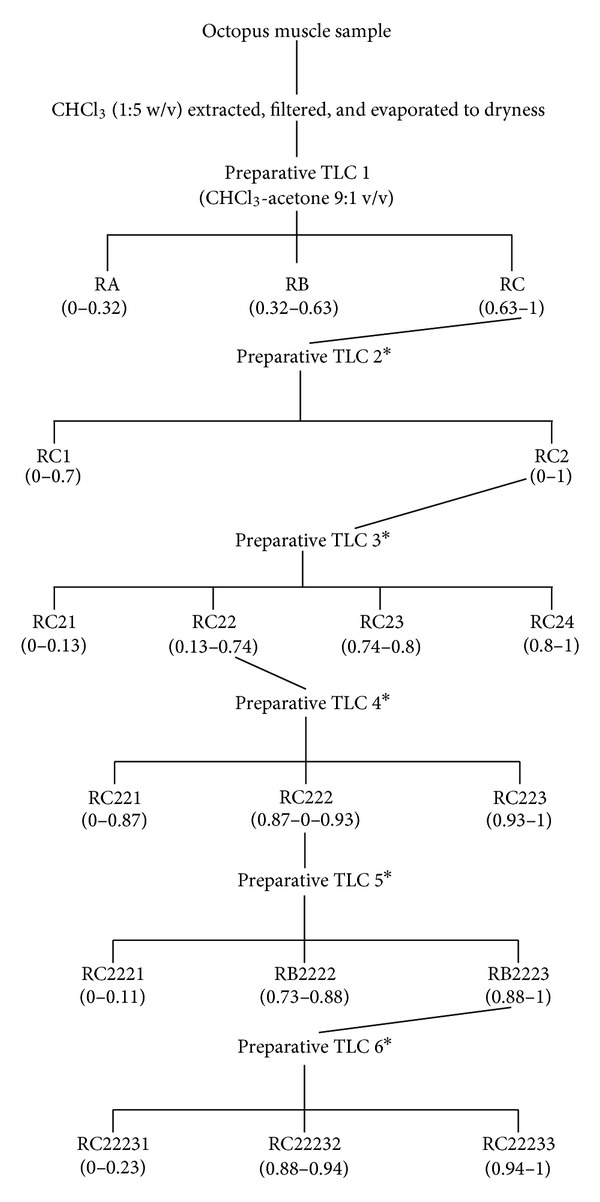
Schematic for separation and isolation of antiproliferative fractions from octopus. Numbers in parenthesis are R f values. *TLC procedure conditions were identical to TLC1.

Schematic for separation and isolation of antiproliferative fractions from octopus. Numbers in parenthesis are R f values. *TLC procedure conditions were identical to TLC1.