Figure 2.

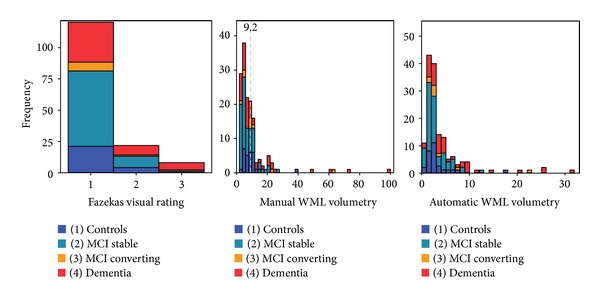
Histograms of WML distribution in the three methods compared. (a) Fazekas visual rating (grade). (b) Manual MRIcron volumetry (cm3). Dashed green line shows tertile 2 cut off. (c) Automatic FreeSurfer volumetry (cm3).

Histograms of WML distribution in the three methods compared. (a) Fazekas visual rating (grade). (b) Manual MRIcron volumetry (cm3). Dashed green line shows tertile 2 cut off. (c) Automatic FreeSurfer volumetry (cm3).