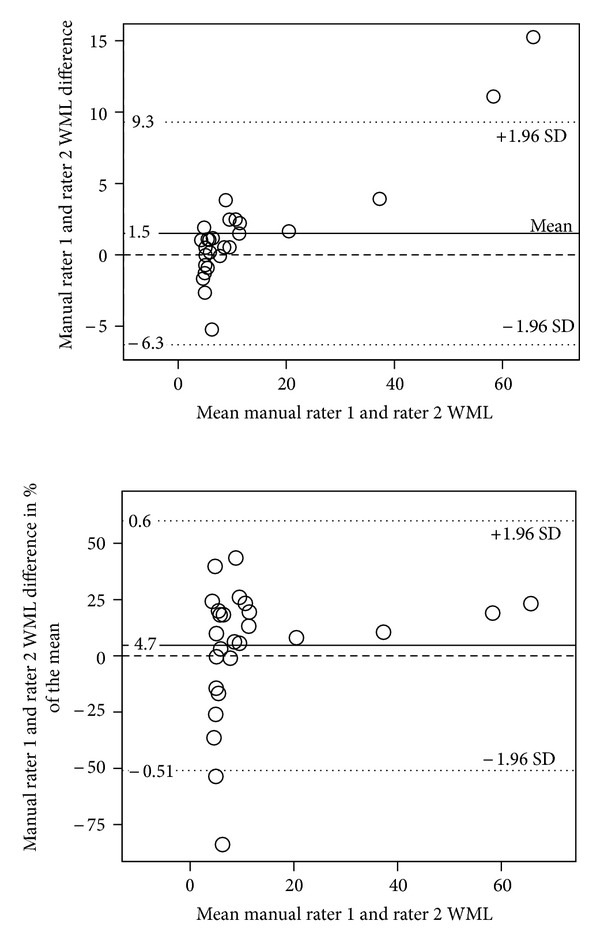
Figure 3.

(a) and (b) Bland-Altman plots of the interrater differences for the manual MRIcron WML method in cm3. The x-axes contain mean WML volumes; the y-axis contains absolute differences in (a) image and fractional difference of mean volume in (b). The dashed line designates the no differences level.
