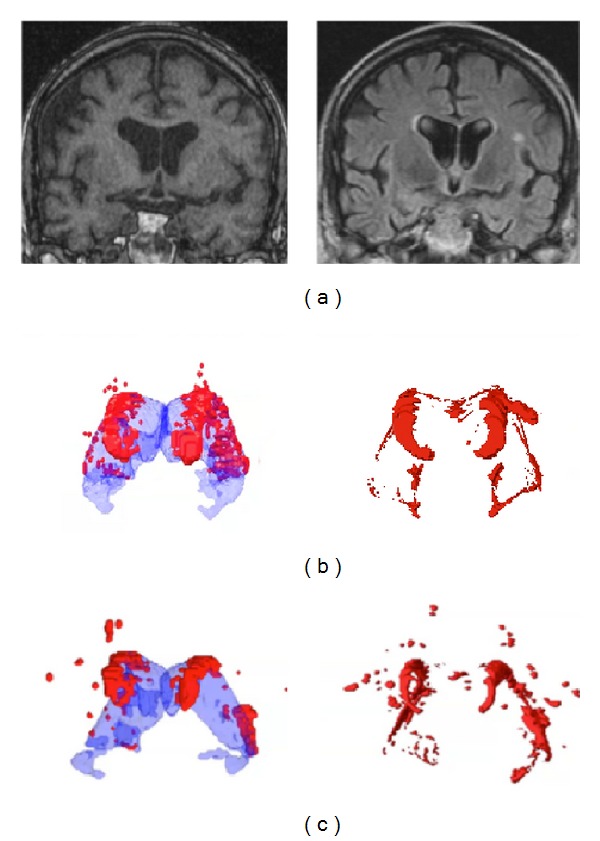
Figure 6.

3D visualizations and MRI images of WML assessed by FreeSurfer and in manual volumetry. (a) MRI images of a dementia patient. The left image shows a T1 original image used in the FreeSurfer assessment where there are FreeSurfer findings of punctate WML. The FLAIR image to the right in the corresponding position contains a large punctate WML patch close to the superior cortical part of the left insula which is hardly visible in the T1 image. (b) The same dementia patient with WML burden (in red) at approximately the same manually extracted high-burden WML volume as the control subject. FreeSurfer assessment is shown to the left with the lateral ventricles visualized in transparent blue, and manual volumetry is shown to the right. (c) Control subject with WML burden (in red) at approximately the same manually extracted high-burden WML volume as the dementia patient. FreeSurfer assessment is shown to the left with the lateral ventricles visualized in transparent blue. Manual volumetry is shown to the right.
