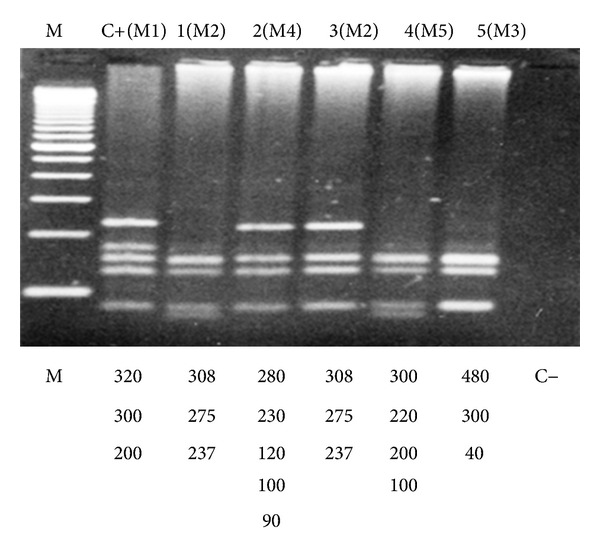
Figure 3.

Digestion patterns with the enzyme MboI found in some analyzed samples. Electrophoresis in 2% agarose gel 1000, stained with ethidium bromide. M marker of molecular weight; C+(M1); 1(M2); 2(M4); 3(M2); 4(M5); 5(M3); C-negative control. Note 1: Pattern M4 was the most frequent, with 15 patients (25.8%). Note 2: patient 1(M2) presented very clear bands in this analysis, but in a posterior analysis it was possible to classify this patient in group M2.
