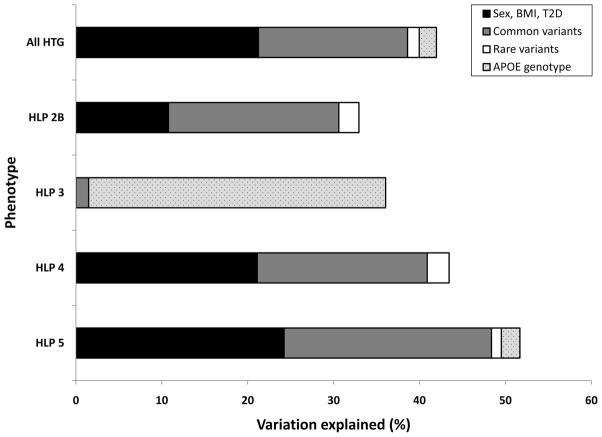
Figure 5.
Comparison of variation attributable to clinical and genetic variables among polygenic HLP-HTG phenotypes within our cohort. The proportion of variation explained was calculated from changes in model fit (R2) from multiple logistic regression entering clinical and genetic variables using forward modeling. Common variants included risk alleles (0, 1, or 2 alleles) from multiple TG-associated loci selected by the model. BMI, body mass index; T2D, type 2 diabetes.

