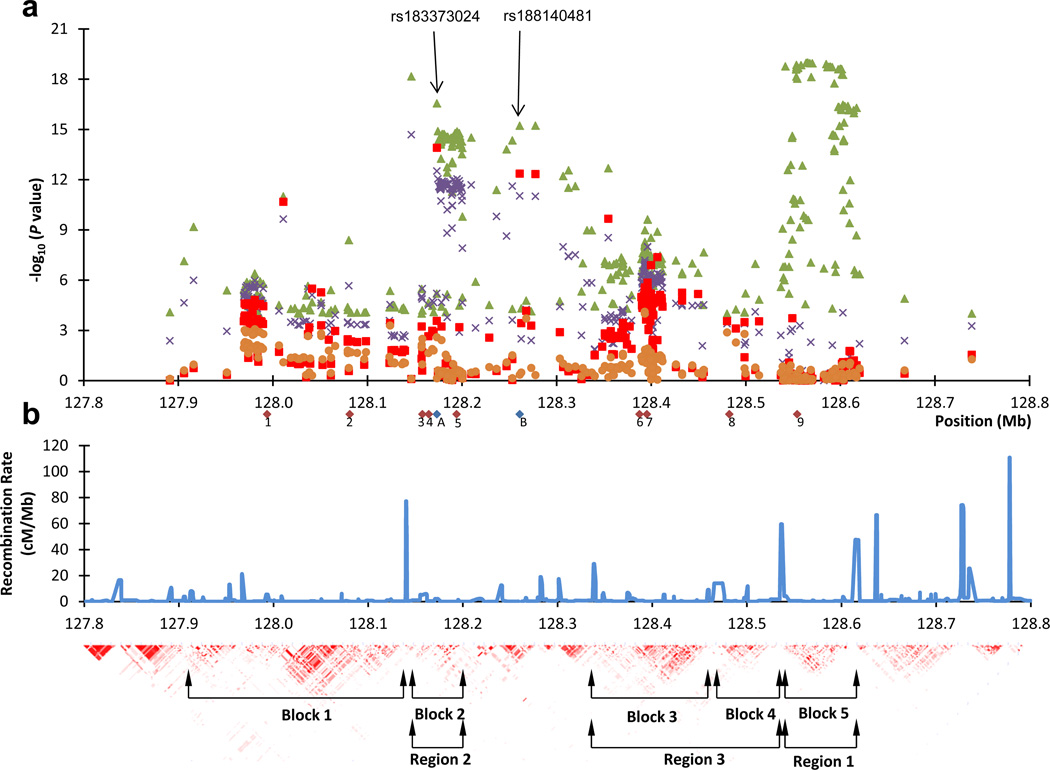
Figure 1.
Schematic view of a region on chromosome 8q24 containing several prostate cancer risk variants. a) Shown are imputed association results, using only results based on chip-genotyped subjects, for variants with P < 1E-4 in the Icelandic prostate cancer GWAS and located between 127.8 Mb and 128.8 Mb (Build 36) on 8q24. Green triangles denote imputed association results (-log(P-value) of the unconditional analysis. Purple crosses denote association results after step-1 of the conditional analysis (the logistic regression), red boxed denote association results after step-2, and orange circles denote association result after step-3. The red diamonds below the X-axis denote the previously reported prostate cancer risk SNPs on 8q24 in populations of European descent (1, rs1254366314; 2, rs1008690811,14; 3, rs101634314; 4, rs1325229814; 5, rs169019798; 6, rs1690209412; 7, rs44511412 / rs62086113,14; 8, rs69832679; 9, rs14472957) and the two blue diamonds denote the two SNPs (A, rs183373024 and B, rs188140481) discussed in the main text. b) Shown are the CEU HapMap population recombination rate and the pairwise correlation coefficient (r2) for SNPs in the 1 megabase (Mb) region depicted. The annotations of blocks/regions is as previously described 7–9,14,21.

