
Table 3.
Hazard odds of adolescent first sexual intercourse of black compared with white adolescents, by segregation, in multiple hierarchical discrete time-to-event models: National Longitudinal Survey of Youth 1997 (1997–2005)a
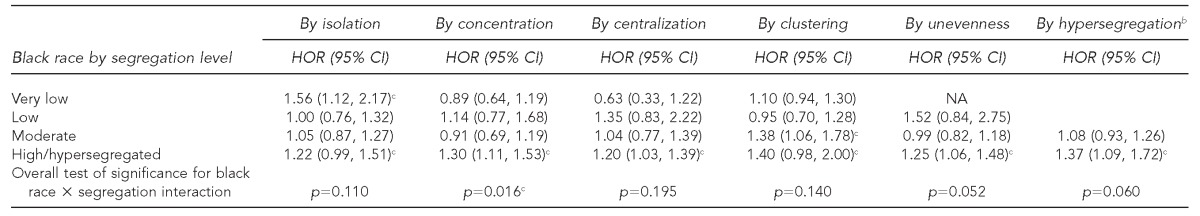
aRace X segregation models include all covariates (adjusted).
bHypersegregation categories are hypersegregated and not hypersegregated.
cStatistically significant at p≤0.05
HOR = hazard odds ratio
CI = confidence interval
NA = not applicable