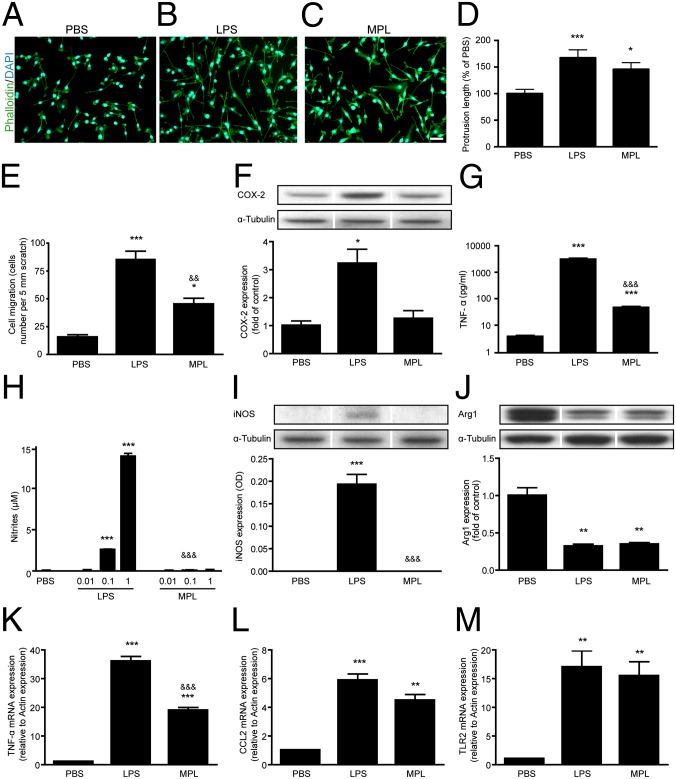
Fig. 2.
MPL induces a low inflammatory response in microglia. BV-2 microglia were stimulated for 24 h with 1 μg/mL of LPS or MPL. F-actin (green) was stained with phalloidin to expose different cell morphologies: (A) nonactivated amoeboid shape, (B) LPS-activated elongated and multipolar morphology, and (C) an MPL-induced intermediate phenotype. (Scale bar, 100 μm.) (D) Total protrusion length was measured in a minimum of 70 cells per treatment group. (E) The migration of BV-2 cells was assessed using the scratch assay test (n = 3). (F) No induction of COX-2 was observed following MPL stimulation in contrast to LPS (n = 3–4). (G) A strong TNF-α secretion was seen in the media of LPS-incubated cells, whereas low levels were detected for MPL-treated cells (n = 6). (H and I) MPL did not generate nitrites or iNOS expression in comparison with the robust induction by LPS (n = 3–6). (J) Arginase 1 levels were similarly reduced following LPS or MPL stimulation (n = 3). (K) Two hours after cell stimulation, the transcriptional activation of TNF-α was lower in MPL-treated cells than in those treated with LPS. (L and M) Both MPL and LPS induced comparable levels of CCL2 and TLR2 mRNA at 2 h poststimulation (n = 3). The lanes were run on the same gel but were noncontiguous. Data are expressed as the means ± SEM. *P < 0.05, **P < 0.01, ***P < 0.001 (vs. PBS); &&P < 0.01, &&&P < 0.001 (vs. LPS).

