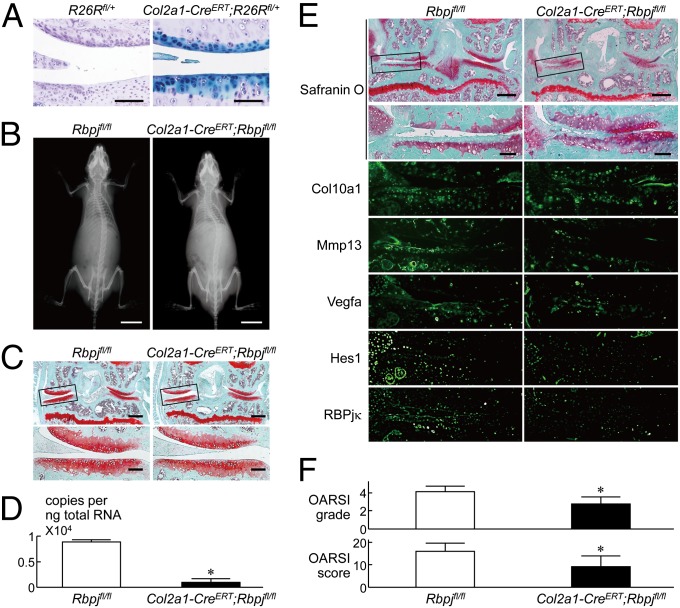
Fig. 3.
OA development in Col2a1-CreERT;Rbpjfl/fl mice. (A) Beta-galactosidase (LacZ) staining of knee joints of Col2a1-CreERT;R26Rf/+ mice and the Cre negative control littermates (R26Rf/+) 8 wk after tamoxifen induction (16 wk old). (Scale bars, 100 μm.) Haematoxylin staining was performed as a counterstain. (B) Plain radiographs of the entire bodies of Rbpjfl/fl and Col2a1-CreERT;Rbpjfl/fl littermates (8 wk old) after tamoxifen injection for 5 d. (Scale bars, 10 mm.) (C) Safranin O staining of mouse knee joints in 8-wk-old Rbpjfl/fl and Col2a1-Cre;Rbpjfl/fl littermates above under physiological conditions. Insets in the Upper safranin O-stained image indicate the regions shown in the enlarged images (Lower). (Scale bars, 400 μm and 100 μm for low and high magnification images, respectively.) (D) mRNA levels of Rbpj in articular chondrocytes from Rbpjfl/fl and Col2a1-CreERT;Rbpjfl/fl littermates above (8 wk old). Data are expressed as means ± SD *P < 0.01 versus Rbpjfl/fl. (E) Cartilage degradation assessed by safranin O staining and immunofluorescence with antibodies to Col10a1, Mmp13, Vegfa, Hes1, and RBPjκ in mouse knee joints 8 wk after creating a surgical OA model in 8-wk-old Rbpjfl/fl and Col2a1-CreERT;Rbpjfl/fl littermates above. Insets in the Upper safranin O-stained images indicate the regions shown in the enlarged safranin O-stained or immunofluorescence images (Lower). (Scale bars, 400 μm and 100 μm for low and high magnification images, respectively.) (F) Quantification of OA development by Osteoarthritis Research Society International (OARSI) grading systems. Data are expressed as means ± SD of nine mice per group. *P < 0.05 versus Rbpjfl/fl.

