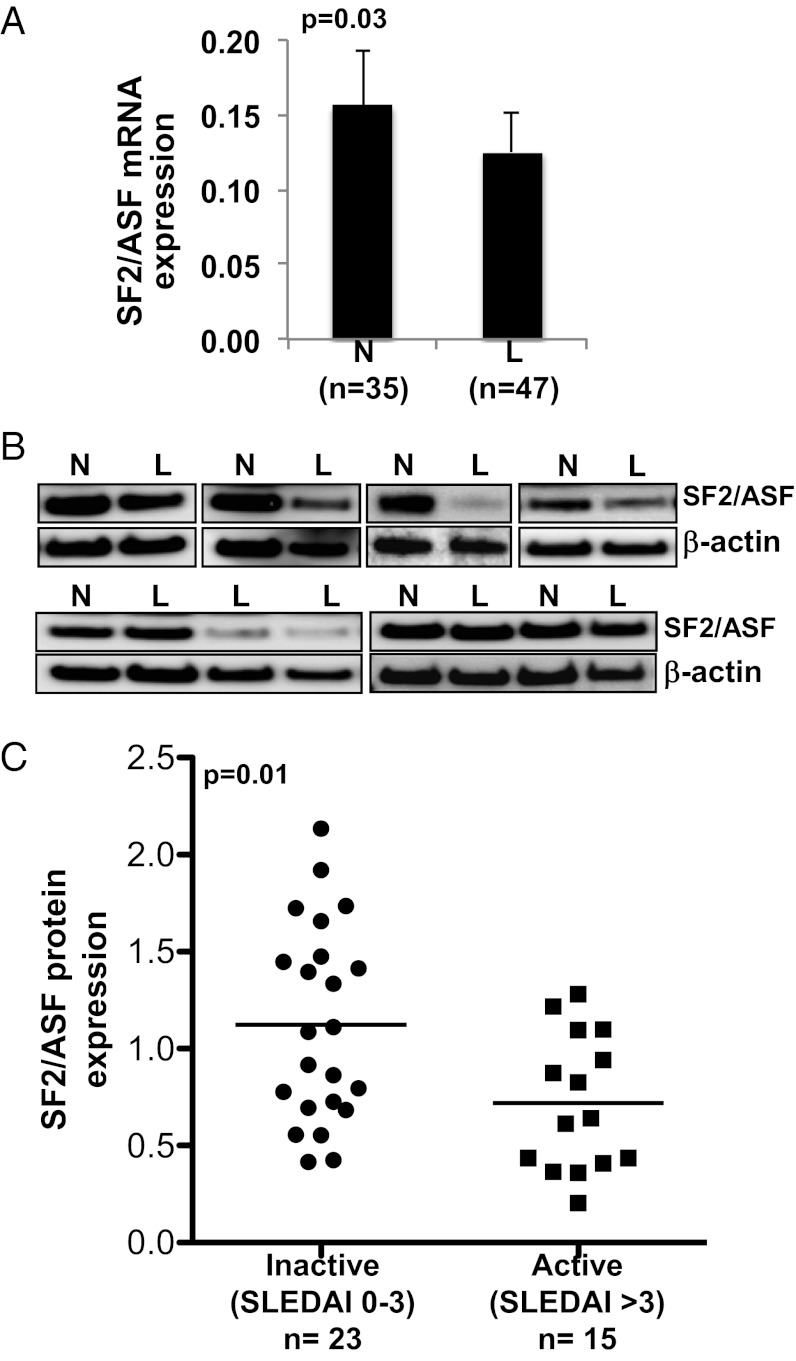
Fig. 1.
SF2/ASF expression in T cells from patients with SLE and control subjects. T cells were purified from peripheral blood of patients with SLE (marked with “L”) and matched healthy donors (“N”). (A) Total RNA was isolated and reverse transcribed. SF2/ASF expression was measured by quantitative PCR and normalized to the average of GAPDH and CD3ɛ housekeeping genes. Graph shows average values, and error bars represent SEM. (B) Total protein was isolated from T cells and immunoblotted for SF2/ASF and β-actin. Representative blots are shown. (C) Densitometric quantitation of SF2/ASF from immunoblots was performed and normalized to β-actin. Graph shows relative SF2/ASF expression in patients with SLE normalized to expression from healthy control subjects, and grouped by SLEDAI score.

