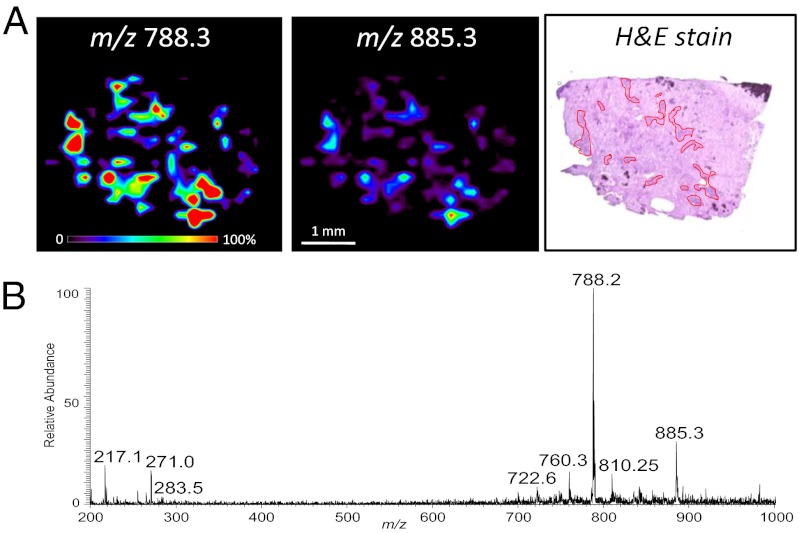
Fig. 4.
DESI-MS imaging of surgical sample S23 from case 4, meningioma. (A) Negative mode DESI-MS ion images showing the distribution of m/z 788.3 and m/z 885.3. Optical image of H&E-stained serial section is shown with the main regions containing meningioma cells delineated with red lines within connective tissue. The distribution of meningioma cells observed by microscopy correlates with the distribution of ion signal characteristic of meningiomas from the DESI-MS images. (B) Negative-ion mode mass spectrum of meningioma region of tissue section, showing characteristic meningioma lipid profile.

