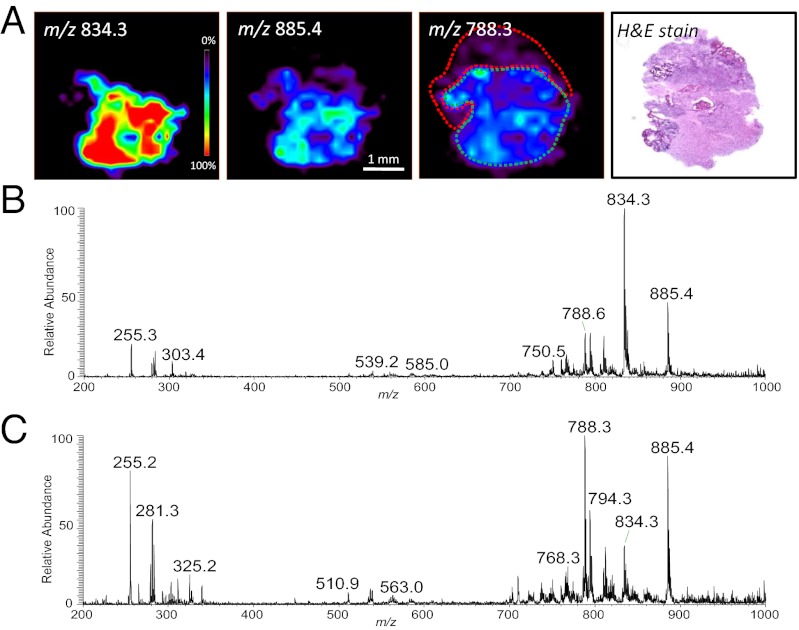
Fig. 5.
DESI-MS imaging of surgical sample D14 (Case 8), astrocytoma grade IV, showing regions of heterogeneity as recognized by histopathological evaluation. (A) DESI-MS ion images showing the distribution of m/z 834.3, m/z 885.4, and m/z 788.3, and optical image of H&E-stained tissue section. (B) Low tumor cell concentration region infiltrating into gray matter (delineated in green in the same ion image). (C) DESI-MS mass spectrum of dense tumor region (delineated in red in the m/z 788.3 ion image), with high tumor cell concentration.

