Fig. 3.
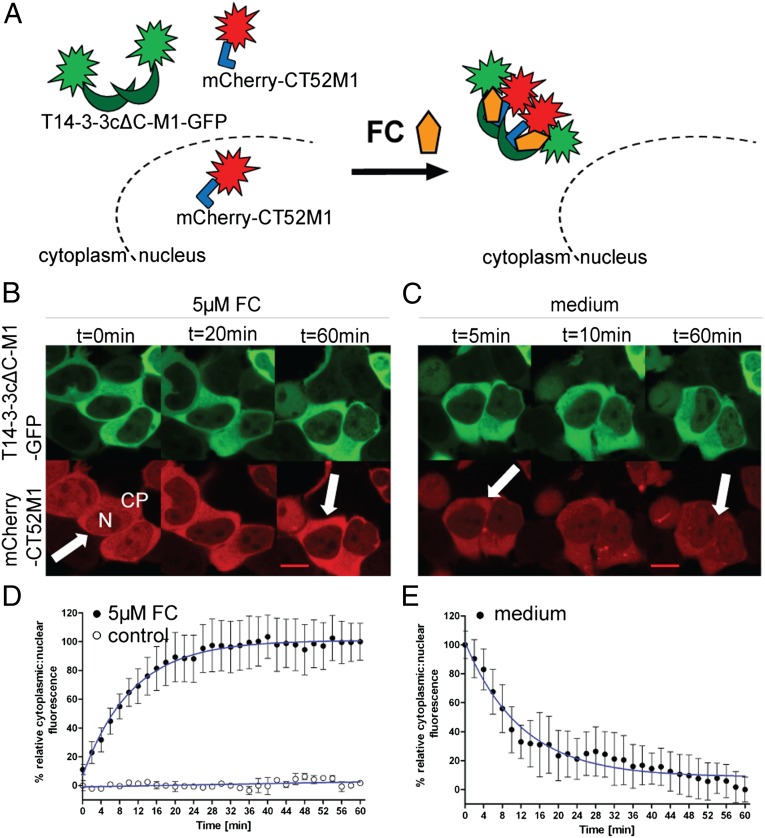
FC-induced nuclear exclusion of mCherry-CT52M1. (A) Schematic representation of FC-dependent nuclear export of mCherry-CT52M1. (B and C) Time-course images of HEK293T cells transfected with plasmids encoding for T14-3-3cΔC-M1-GFP and mCherry-CT52M1 at stated times, monitoring nuclear exclusion of mCherry-CT52M1 fluorescence after the addition of 5 µM FC (B) and its reverse translocation after the cells were washed with medium (C). See SI Appendix, Fig. S6A for control cells treated with solvent (3.3% ethanol). (Scale bars, 10 μm.) CP: cytoplasm; N, nucleus. (D and E) Quantification of mCherry-CT52M1 translocation in response to 5 µM FC and the analysis of untreated cells (control) (D) and of the reversibility of mCherry-CT52M1 translocation (E). Mean cytoplasmic and nuclear fluorescent intensities were calculated every 2 min and plotted as a ratio against time. The data represent mean values (± SEM) from three experiments with at least two cells per experiment; n = 6–9. To obtain the EC50 curve, fitting was performed using nonlinear regression and one-phase exponential association.

