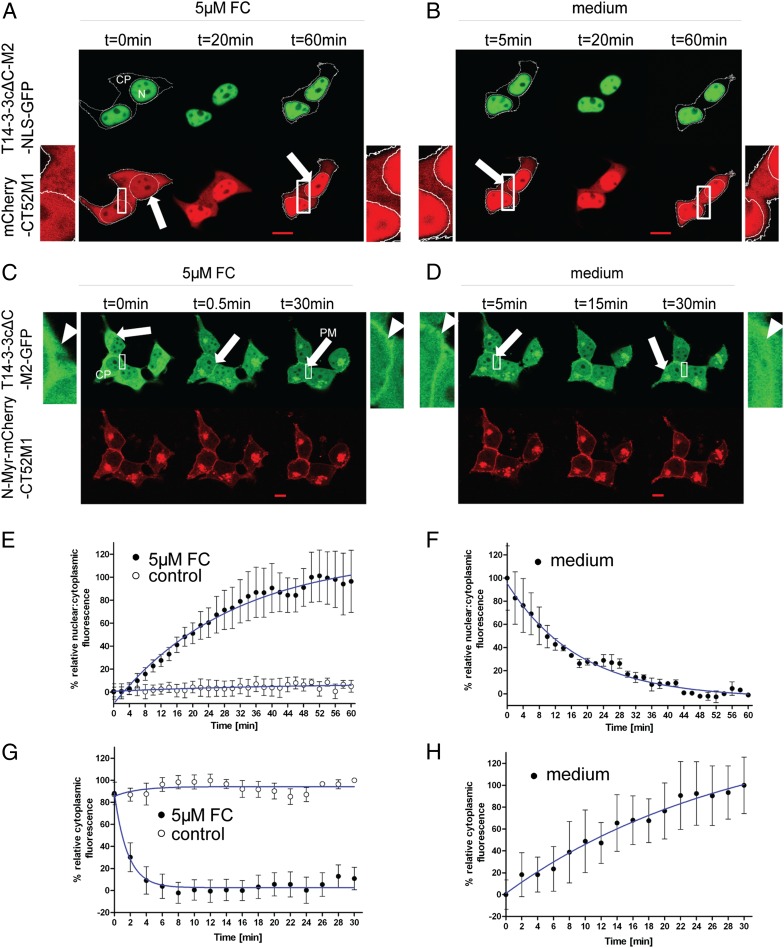
Fig. 4.
FC-induced nuclear accumulation of mCherry-CT52M1 and plasma membrane recruitment of T14-3-3cΔC-M2-GFP. (A and B) Time-series images of HEK293T cells transfected with plasmids encoding for T14-3-3cΔC-M2-NLS-GFP and mCherry-CT52M1 at stated times, showing nuclear accumulation of mCherry-CT52M1 fluorescence after the addition of 5 µM FC (A) and its reverse translocation after the cells were rinsed with FC-free medium (B). The additional images on the right and left of the center panel are enlarged from the respective boxed areas. Arrows indicate the relative increase in fluorescence intensity in the nucleus concomitant with the relative decrease in fluorescence intensity in the cytoplasm. (C and D) Corresponding time courses of cotransfected T14-3-3cΔC-M2-GFP and N-Myr-mCherry-CT52M1, showing partial colocalization of both proteins at the plasma membrane (arrows) after the addition of 5 µM FC. Enlarged images of the boxed areas in the center panels show the relative increase in fluorescence intensity at the plasma membrane concomitant with relative decrease in fluorescence intensity in the cytoplasm (arrowheads) (C) and reverse translocation of T14-3-3cΔC-M2-GFP into the cytoplasm after the cells were washed with medium (D). See SI Appendix, Fig. S6 B and C for control cells treated with solvent (3.3% ethanol). (Scale bars, 10 μm.) (E and F) Quantification of mCherry-CT52M1 translocation efficiency in response to 5 µM FC and the analysis of untreated cells (E) and of the corresponding reversibility of mCherry-CT52M1 translocation (F). Mean nuclear and cytoplasmic fluorescent intensities of mCherry-CT52M1 were calculated every 2 min and plotted as a ratio against time. (G and H) Quantification of T14-3-3cΔC-M2-GFP translocation in response to 5 µM FC and the analysis of untreated cells (G) and of the corresponding reversibility T14-3-3cΔC-M2-GFP translocation (H). Here the mean cytoplasmic fluorescent intensities of T14-3-3cΔC-M2-GFP were determined and plotted against time. The data represent mean values (± SEM) from three experiments with at least two cells per experiment; n = 6–14.

