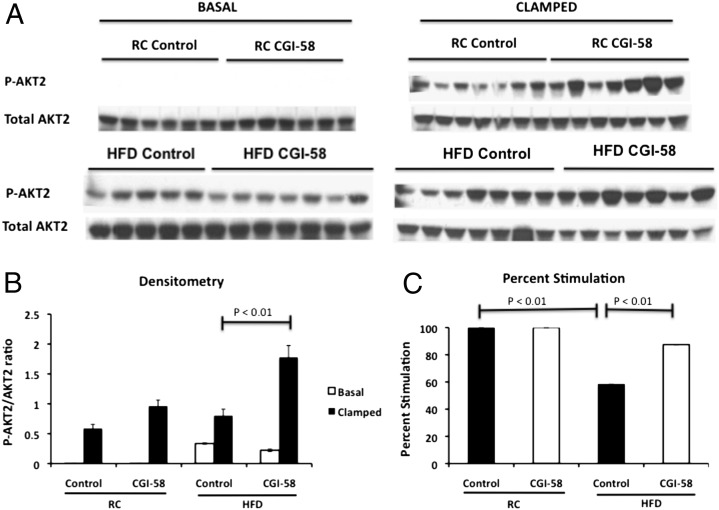
Fig. 3.
Hepatic insulin signaling is enhanced with CGI-58 knockdown. (A) Western blot analysis of phosphorylated AKT2 (Ser474) in the liver of control or CGI-58 ASO-treated mice in the basal or clamped state. Twenty micrograms of protein were run on a SDS/PAGE gel. (B) Densitometry of the phosphorylated AKT2 described in A. (C) The percent stimulation of AKT2 phosphorylation between the basal and insulin-stimulated states as determined by densitometry. P value was calculated by two-way ANOVA.

