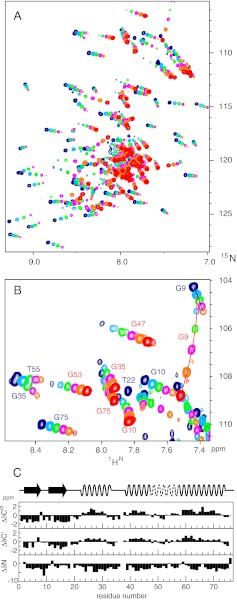
Fig. 6.
(A) Pressure-induced unfolding of ubiquitin in 45% methanol at 308 K 1H-15N HSQC recorded on a 600-MHz spectrometer at pressures of 1 (dark blue), 500 (blue), 1,000 (green), 1,500 (magenta), 2,000 (orange), and 2,500 bar (red), respectively. (B) Expanded region of A showing the transition in the glycine region. Resonances are labeled with assignment information corresponding to the native state (dark blue) or the pressure-induced A-state (red). (C) Secondary chemical shift analysis (13Cα, 13C′, 15N) of the pressure-induced unfolded state of ubiquitin in 45% methanol (308 K, 2,500 bar). The secondary shifts are almost identical to those of the A-state (Fig. 3). Secondary structure elements of the A-state are drawn at the top.

