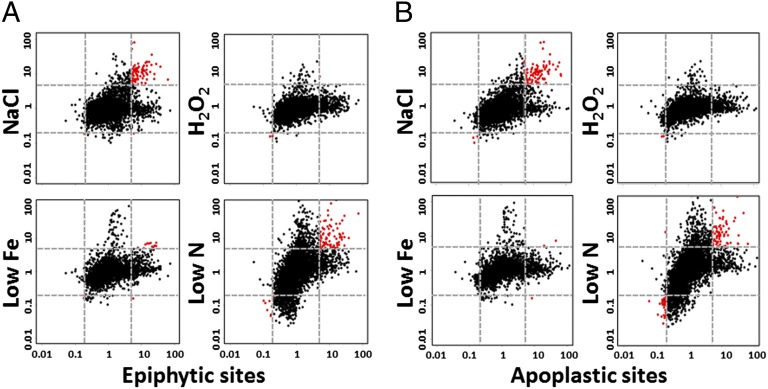
Fig. 2.
Correlation between the P. syringae transcriptomes of cells exposed to environmental stresses in vitro and those recovered from (A) epiphytic sites or (B) apoplastic sites. The log(fold-change) values of the transcript levels of all the genes in the in vitro stress treatments relative to transcript levels in the basal medium (y axes) were plotted against those of the in planta treatments relative to transcript levels in the basal medium (x axes). The dotted gray lines indicate fivefold changes in transcript levels. Red dots indicate genes that were altered fivefold or more in both plotted treatments.

