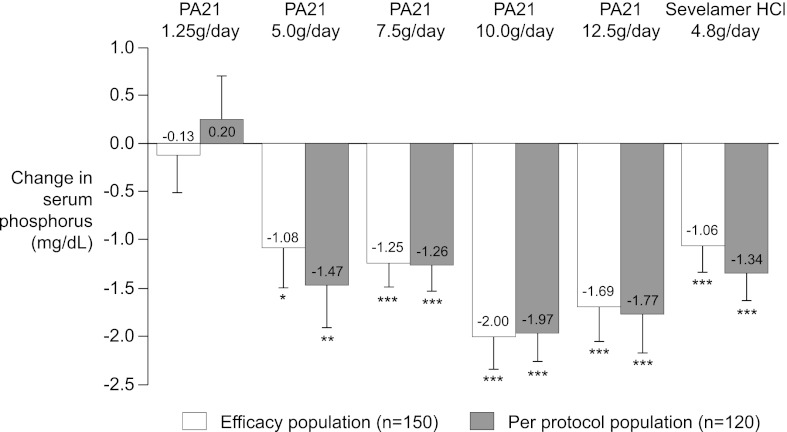
Figure 2.
Change in serum phosphorus from baseline (week 1) according to treatment group. Data are shown as mean (SEM) change from baseline to end of treatment (primary endpoint) according to treatment group (efficacy and per protocol populations) (last observation carried forward, LOCF). *P=0.02, **P=0.003, ***P<0.001 (all versus baseline).

