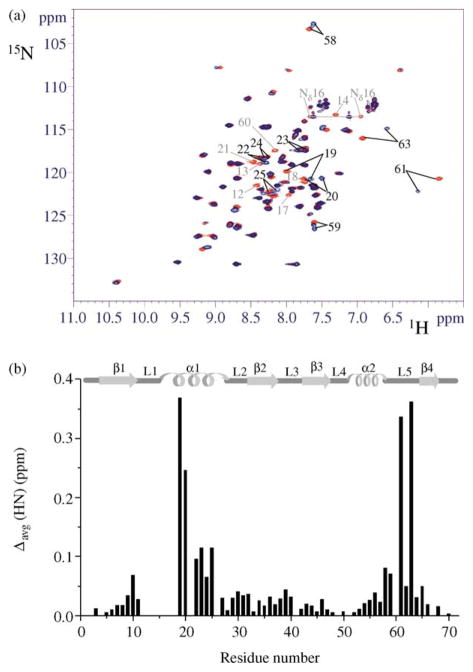
Figure 1.
Effect of Cd(II) binding to NTKII on 1H–15N HSQC spectra. (a) The 2D 15N–1H HSQC spectra (600 MHz, 298 K) of CdNTKII (blue) and of apoNTKII (red). Residues whose 1H–15N cross-peaks disappear upon Cd(II) binding are indicated in light grey. For both samples the protein concentration was about 1.5 mM, in 350 mM phosphate buffer (pH 7). (b) The weighted average chemical shift differences Δavg(HN) (i.e. [(ΔH)2 + (ΔN/10)2]1/2, where ΔH and ΔN are chemical shift differences for 1H and 15N, respectively) are shown. Chemical shift differences are not reported for residues 12–18, 21 or 60, as their 1H–15N cross-peaks are not observed for Cd(II) form. The secondary structure elements of apoNTKII are reported at the top.

