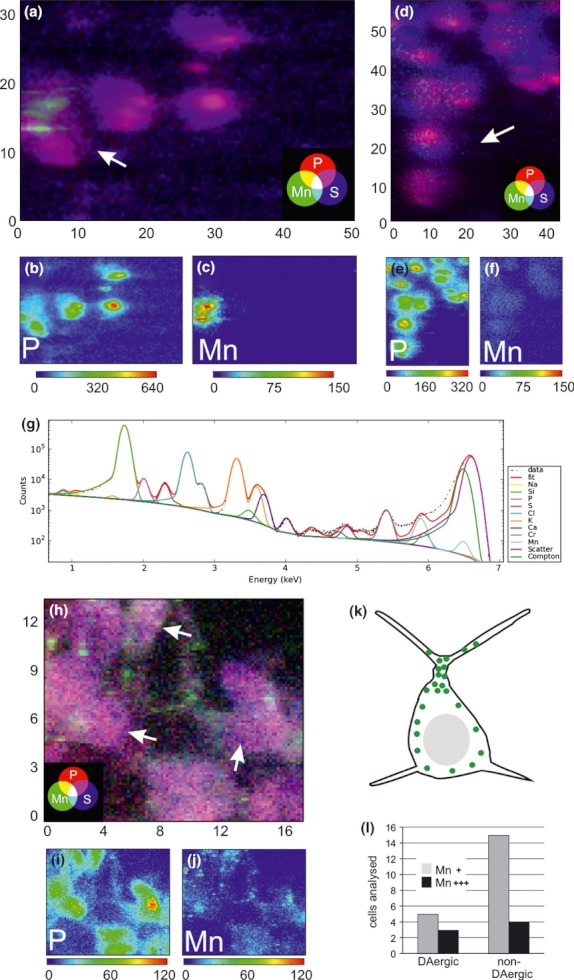
Fig. 4.

Typical XRF maps and summarized spectrum of midbrain dopaminergic neuron treated with 500 μM Mn2+ (a–c, h–j) and 50 μM Mn3+ (d–f) at 6.6 keV. (a) Merged maps of cryo-fixed cultures indicating Mn (green), P (red) and S (blue). (b, c) Single element maps for P (b) and Mn (c) of cells shown in (a). Image size 40 × 32.5 μm, pixel size 0.5 × 0.5 μm, dwell time 800 ms. (d) Merged maps of cryo-fixed cultures indicating Mn (green), P (red), and S (blue). (e, f) Single element maps for P (e) and Mn (f) of cells shown in (d). Image size 45 × 60 μm, pixel size 0.5 × 0.5 μm, dwell time 800 ms. Dynamic color scales indicate number of normalized counts. (g) Typical cumulative XR-fluorescence spectrum corresponding to measurement shown in (d–f). The following peaks can be distinguished: data (black), fit (red), Na (yellow), Si (green), P (magenta), S (brown), Cl (light blue), K (orange), Ca (purple), Chromium (gray), Mn (cyan), Scatter (pink), Compton (dark green). (h) Merged maps of freeze-dried cultures indicating Mn (green), P (red) and S (blue). Single element maps for P (i) and Mn (j) of cells shown in (h). Image size 17 × 13 μm, pixel size 0.5 × 0.5 μm, dwell time 800 ms. Dynamic color scales indicate number of normalized counts. Arrows in (a, d, and h) indicate dopaminergic neurons. (k) Schematic representation of typical manganese distribution (green dots) found in Mn2+-treated midbrain dopaminergic neuron. (l) Quantification of DAergic and non-DAergic neurons with strong (Mn+++) and weak (Mn+) fluorescence for Mn.
