Figure 6.

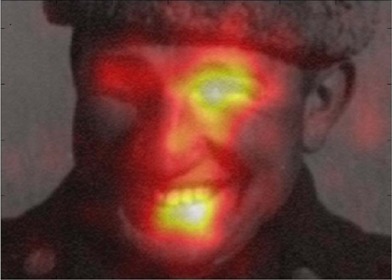
Overall fixation distribution of people free viewing the portrait of Yarbus. The intensity of the coloured overlay indicates the amount of fixation time received across all observers.

Overall fixation distribution of people free viewing the portrait of Yarbus. The intensity of the coloured overlay indicates the amount of fixation time received across all observers.