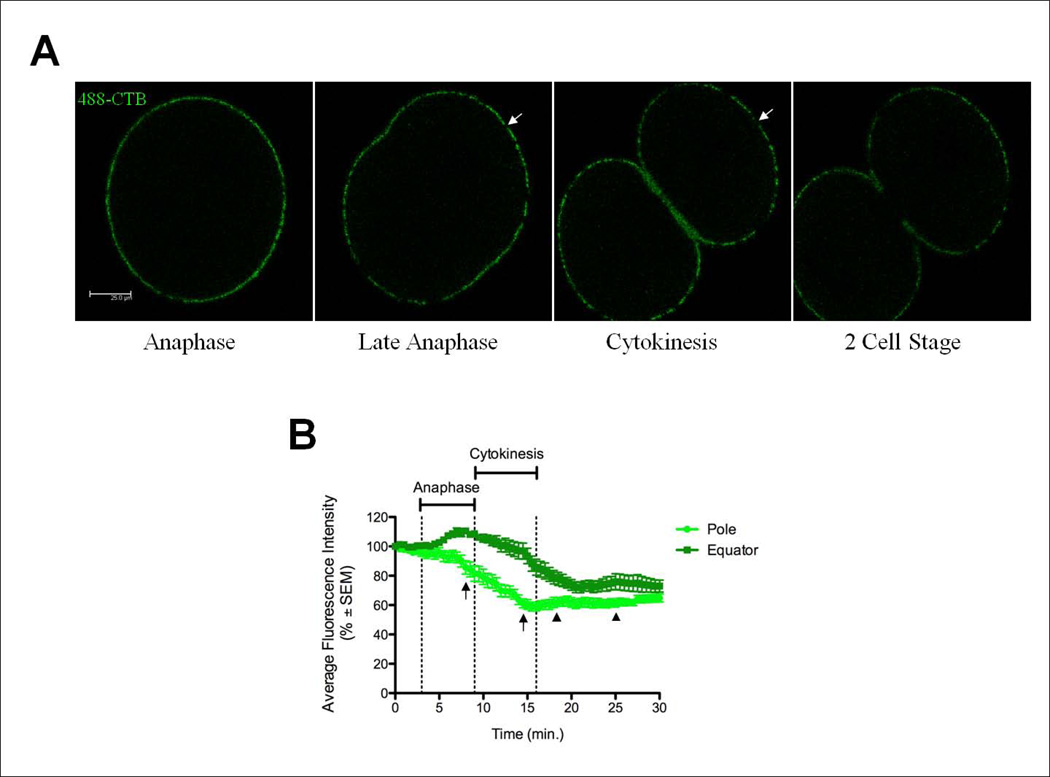
Figure 3.
The plasma membrane expands at the polar regions while compressing at the equatorial regions. (A) New membrane was added at the polar regions as shown by the expansion of unstained regions (arrows). Scale bar represents 25µm. See also Movie S1 in supplemental material. (B) Fluorescence intensity values were calculated at the pole or equator for zygotes pulse stained with 488-CTB for 20 minutes prior to mitosis. The AFI decreased 49.6±2.2% at the poles (n=12 embryos, 14 regions) during anaphase, reaching the maximum decrease at full furrow ingression. At the equator (n=12 embryos, 23 regions), fluorescence intensity increased 27±2.9% prior to cytokinesis, then decreased during furrow invagination. Time is presented in minutes after metaphase onset. Arrows represent the timing of new membrane addition at the poles. Arrowheads represent the duration of new membrane addition at the furrow.

