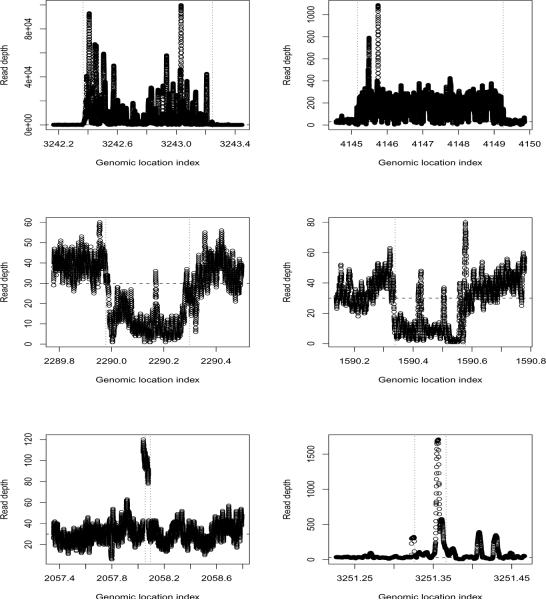
Fig. 4.
Examples of CNV identified on chromosome 19 of NA19240 from the 1000 Genomes Project. Top two plots: duplications, regions with the highest scores; middle two plots: deletions, regions with the smallest scores; bottom two plots: the two shortest CNVs identified. For each plot, the horizontal line presents the median count of 30 and the vertical dashed lines represent the estimated CNV boundaries. For each plot, x-axis is the genomic location in base pairs/10,000.

