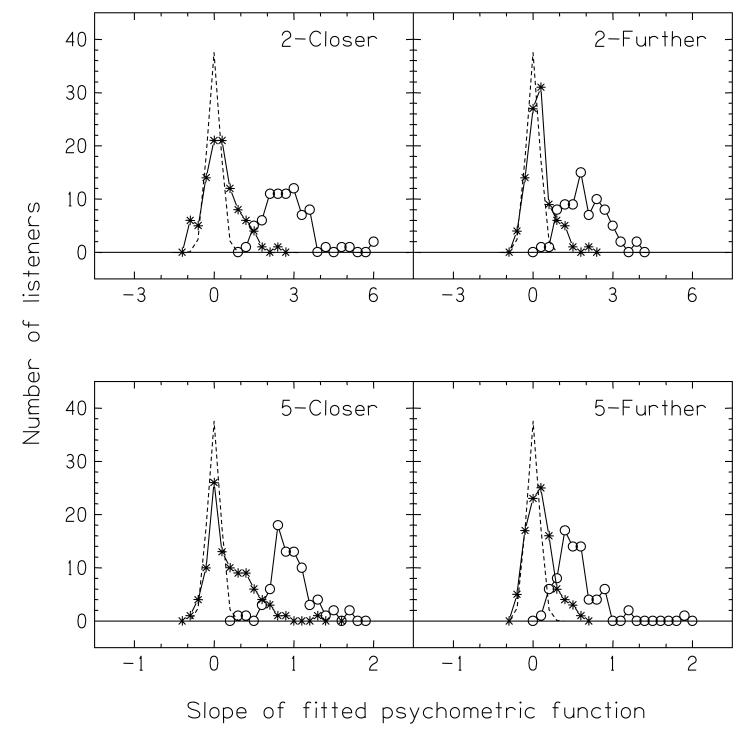
FIGURE 12.
Top left panel: Distribution of the slopes of the individual psychometric functions for the 2-m Closer task in the Normal-level condition (open circles) and in the Equalized-level conditions (asterisks). The dashed line plots the expected distribution given chance performance, found using a computer simulation. Other panels: corresponding results for the other conditions of the experiment. Note that the abscissa for the bottom panels is different from the abscissa for the top panels.

