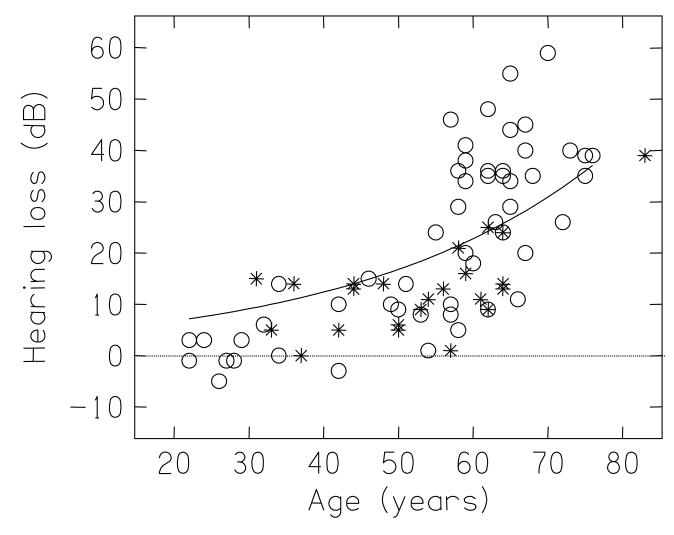
FIGURE 6.
The mean hearing loss in their better ear of the 77 listeners who took part in the experiment, plotted as a function of their age. The values are the average of 500, 1000, 2000, and 4000 Hz. The open circles are those listeners who completed a SSQ questionnaire; the asterisks are those who did not. The solid line plots the mean hearing loss from of the UK National Study of Hearing (Davies, 1995).

