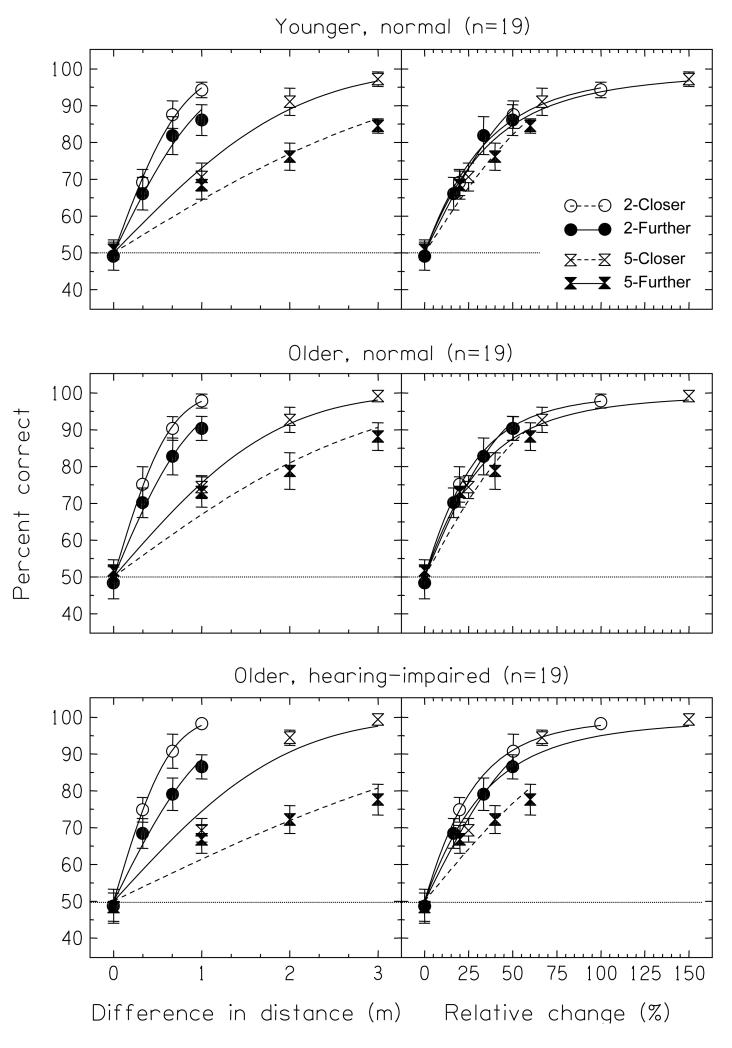
FIGURE 7.
Average psychometric functions for the Normal-level conditions from each of the three groups of listeners (young normal, older normal, and older hearing-impaired). The four functions in each panel are for the four tasks of “2-Closer”, “2-Further”, “5-Closer”, and “5-Further”. In the left column the data is plotted as a function of the difference in distance between the two trials, Δr; in the right column the same data is plotted as a function of the percentage change in distance, Δr/rmin. The lines show psychometric functions fitted to the group data, assuming that was proportional to Δr; the 5-Further psychometric functions are shown by dashed lines to differentiate them from the others. Chance performance is 50%.

