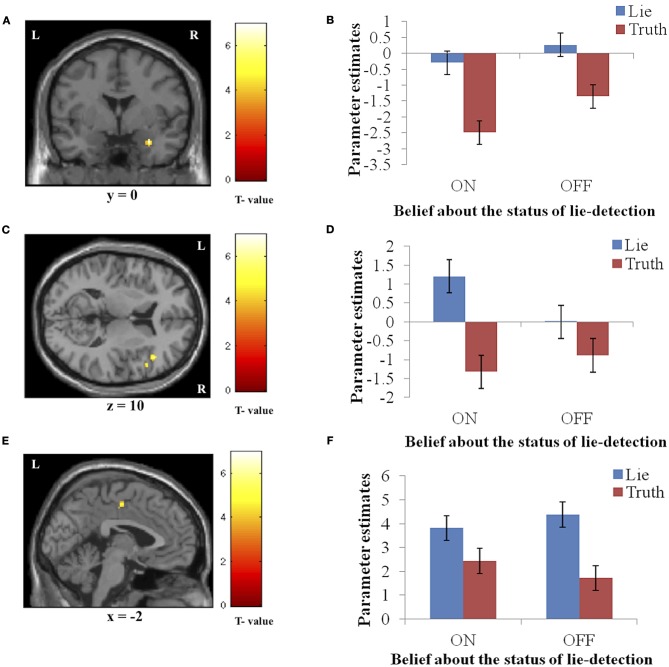
Figure 3.
The main effect of response (false > true). Panels on the left show the activation cluster and panels on the right show mean parameter estimates in the activation cluster in the right amygdala (A and B), right IFG (C and D), and left PCC (E and F). Deceptive responses in these regions yielded higher BOLD activation than truthful ones, and this difference was not significantly modulated by belief about whether the lie detector was on or off.

