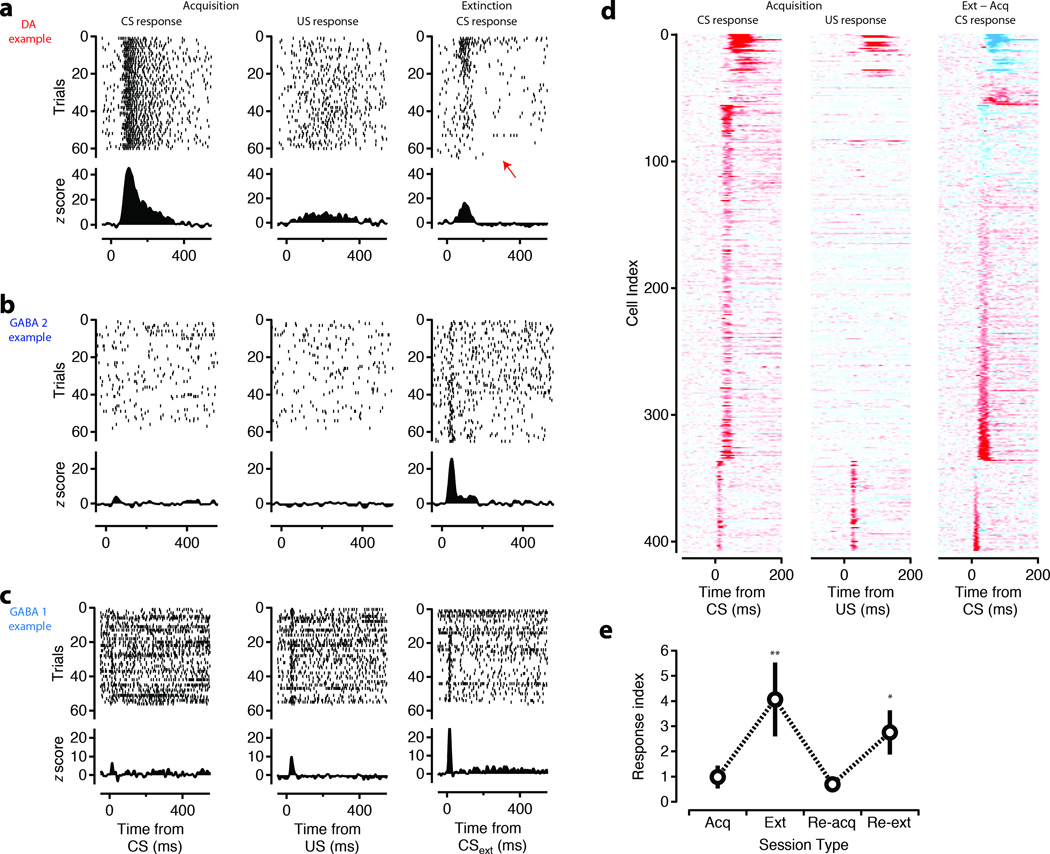
Figure 2. Short latency responses to the CS are enhanced during extinction.
Upper panels show raster plots for 60 trials of representative DA units (a) and ‘extinction cells’ derived from the GABA 2 (b) and GABA 1 (c) groups of units aligned to CS onset (left), US onset (middle), and CSext onset (right). Red arrow indicates the presence of suppression of DA response below baseline in extinction. Shown with increased resolution in Supplementary Figure 4. Lower panels show Z-scored PSTHs. (d) Z-scored PSTHs for the entire population of units with a significant phasic response aligned to CS (left), US (middle), and CSext (right) (<−15 to >15 scaling). Cell index is sorted by the latency of the phasic response and CSext – CS response contrast. (e) Response index ((Acq – Ext)/(Acq + Ext)) for a subset of extinction cells (N=10 in 2 mice) that went through sessions of re-acquisition and re-extinction on the same day. (**, p<0.01; *, p<0.05; t-test, two-tailed).

