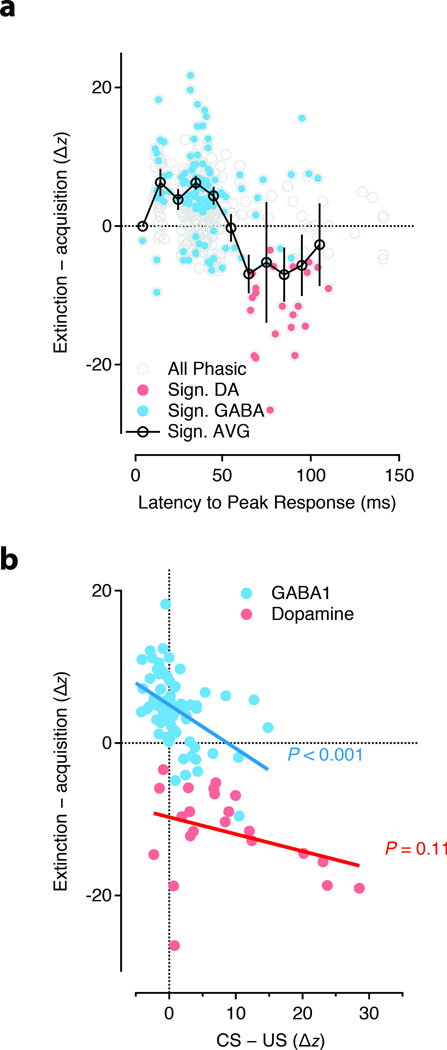
Figure 3. The popuiation response during extinction.
(a) Difference in the phasic response magnitude normalized by response width (’ΔZ’) between acquisition and extinction plotted as a function of the latency to the peak of the response. Significant differences indicated by filled circles for GABA (cyan) and DA (red) units. (b) The CSext – CS contrast plotted as a function of the difference between the CS and US response for GABA 1 (cyan) and DA (red) units. GABA 1 units showed a significant correlation such that units with a strong US response in acquisition developed a strong CSext response. GABA 2 units had no population US response and thus, were not included. P value reflects significance of hypothesis of a nonzero Pearson’s correlation.

