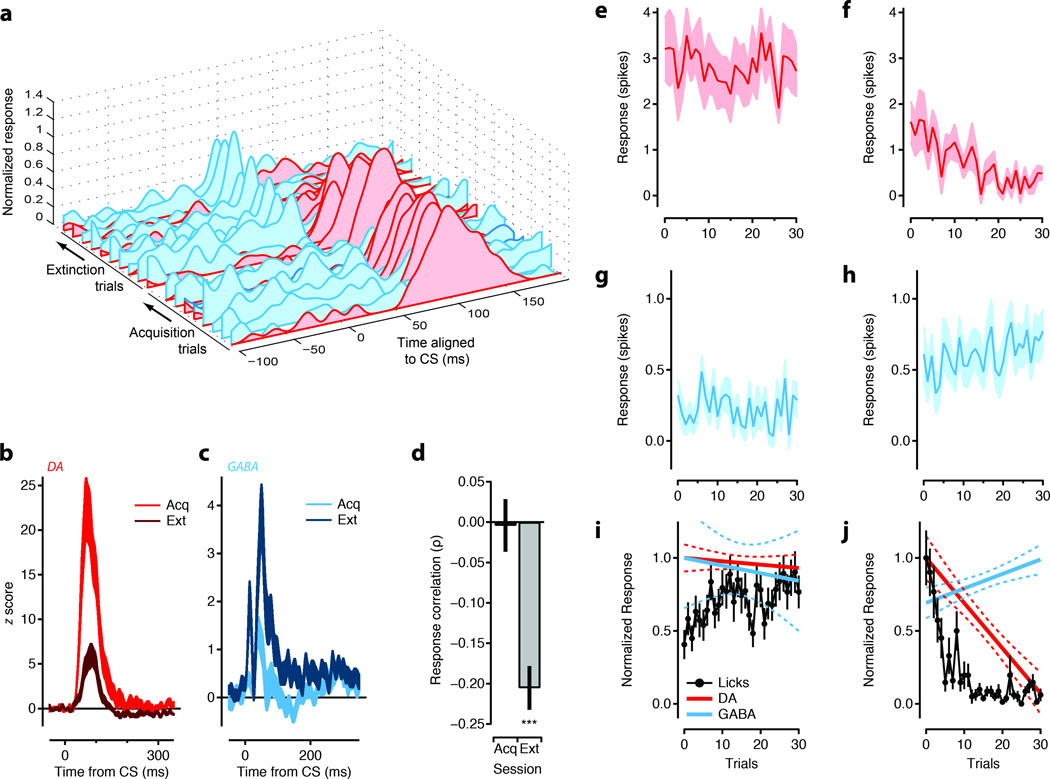
Figure 4. Opposing extinction signals emerge with similar timecourses.
(a) The mean PSTH for each block of trials during acquisiton and extinction are shown for an example simultaneously recorded putative GABA (cyan) and dopamine (DA; red) unit. PSTHs were smoothed using a 10 ms gaussian kernel for each trial and blockwise averages were calculated in 10 trial blocks. (b-c) Population mean PSTHs for simultaneously recorded DA (b; red) and GABA (c; cayn) units during acquisition (‘Acq’, light) and extinction (‘Ext’, dark). (d) For simultaneous recording sessions the pairwise trial by trial correlations (n=74) in the phasic response amplitude between DA and GABA units was calculated. All significant (p≤0.05) correlations from the Ext session were used to calculate the population mean is shown in right bar (n=19; paired t-test for significance of mean correlation). The mean response correlation for the same comparisons during Acq are shown at left. (e-h) The number of spikes above baseline in the phasic response window on a single trial are plotted for the population of DA (e-f) and Extinction cells (g-h). (i-j) Normalized linear fits to the initial 30 trials of Acq (i) and Ext (j) are shown in solid lines with confidence intervals in dashed lines for DA units (red) and extinction units (cyan). Normalized, trial by trial behavioral responses (anticipatory licks per trial; black circles) are also shown for first 30 trials. Error bars are standard error of the mean. Significance: *** = p<0.001 t-test, two-tailed.

