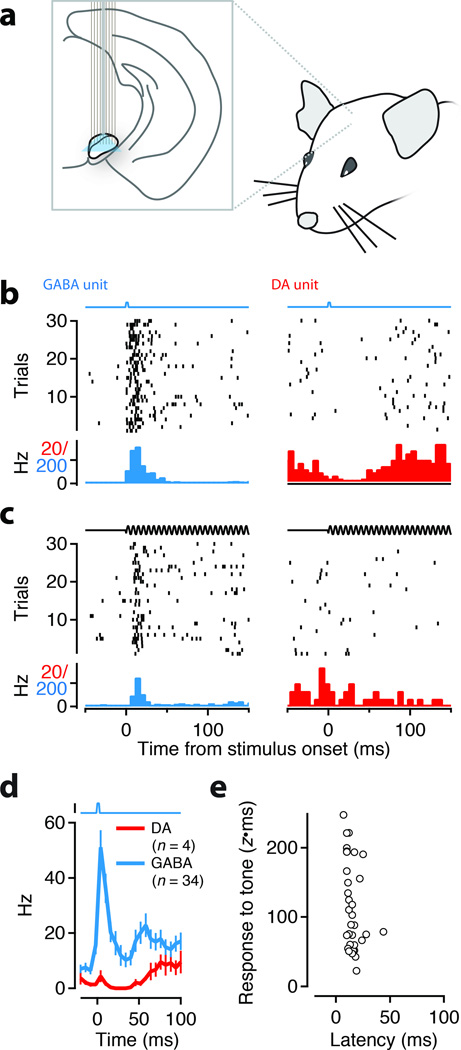
Figure 6. Optogenetic tagging demonstrates that short-latency auditory responses are from GABAergic neurons.
(a) Schematic of the in vivo stimulation and recording experiment. An electrode array with an integrated optical fiber was slowly lowered into the SN of awake, head-fixed mice. Single units were isolated on the recording electrodes. Trials with either light stimulation (1–5 ms pulse, b) or auditory stimulation (500 ms tone, c) were presented to the quietly resting mouse. (b-c) Response of an example GABA (left) unit that was directly activated by light (indicated by square pulse, b) and responded to a tone (indicated by pure tone voltage command, c) with short latency. Response of an example DA unit (right) to light (b) and tone (c). (d) Population data from the head-fixed experiment for all directly photoactivated units (black, ‘GABA’) and the subpopulation of DA units (red). (e) The latency and amplitude of the tone response for all units that exhibited direct photostimulation responses and tone responses (N=34).

