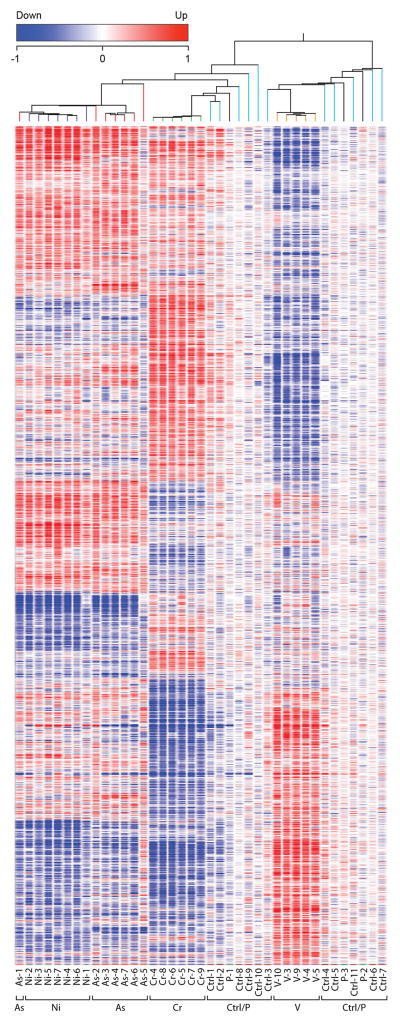
Figure 5. Hierarchical Clustering Dendrogram.
This heatmap shows 4231 genes resulting from a one-way ANOVA with Benjamini-Hochberg Correction, p-value .0001, for all 36 clones (25 metal-transformed clones, 11 controls) and 3 parental cell populations. Genes that were increased in expression compared to their control clones are shown in red while under-expressed genes are depicted in blue. Dendrogram was created in GeneSpring version 11.5 by using a hierarchical clustering algorithm and Pearson-centered distance metric. Clones derived from metal-treated cells generally cluster together and untreated control clones cluster with the parental cell populations.

