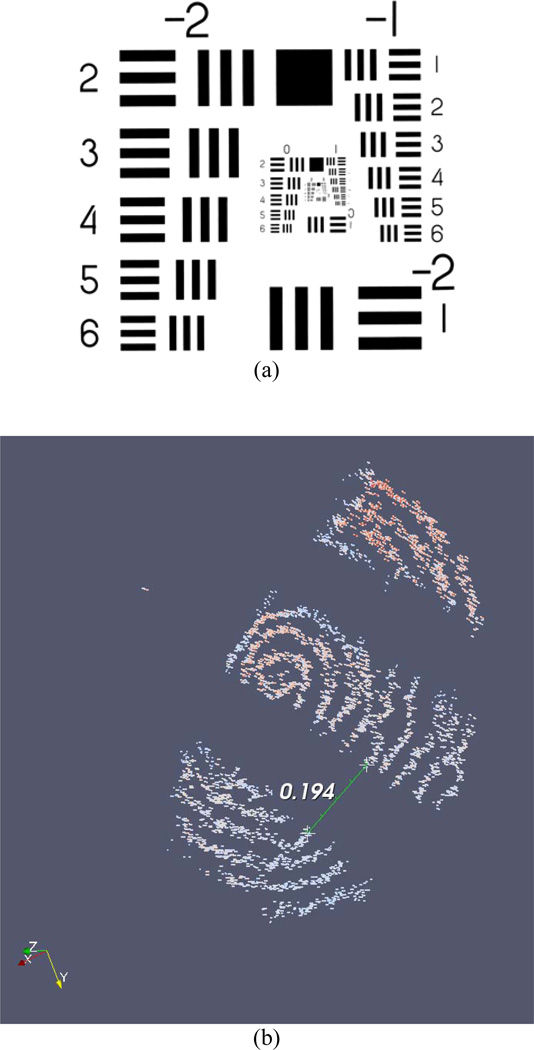
Figure 3.
(a) USAF 1951 MIL-STD-150A resolution test chart. (b) Result of spiral C-mode scan of USAF 1951 MIL-STD-150A resolution test chart, group 1, element 4 (the fourth element below the number “1,” slightly right of center in (a)). The three bars from the element in the chart (which are black in the original chart) are visible in the scan. The space between bars, which measures 0.176 mm on the chart, is measured at 0.194 mm in the acquired scan.

