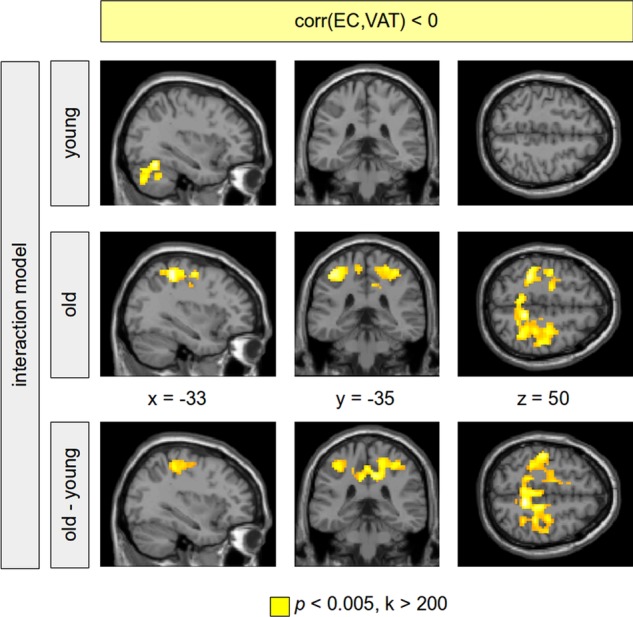
Figure 4.

Negative correlation between eigenvector centrality (EC) and visceral adipose tissue (VAT). Results are shown provided by a full factorial model (VAT–age interaction) including all subjects. In the group of old subjects, a significant negative EC–VAT correlation was obtained predominantly in regions of primary motor functions (second row, colour-coded in yellow). This correlation was not observable in the group of young-to-mid-age adults (first row). The difference between both groups (the VAT–age interaction) was significant showing the age-related specificity of this VAT–age interaction. Clusters were reported using a voxel threshold of p<0.005. In order to control for false positives, significant clusters are shown with a minimum cluster size of k>200. Those clusters were significant using a family-wise error corrected p<0.05.
