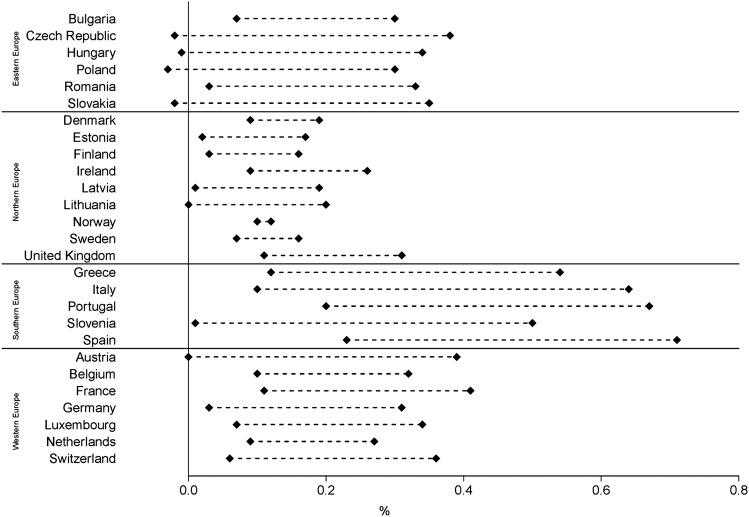
Figure 1.
The range of the absolute increase in RHAs attributed to heat between the two periods (1981–2010, 2021–2050) as a proportion of the annual expected number of RHAs for each of the 27 countries. The points show the highest and lowest estimates from four climate models under two emission scenarios.

