
Figure 3.
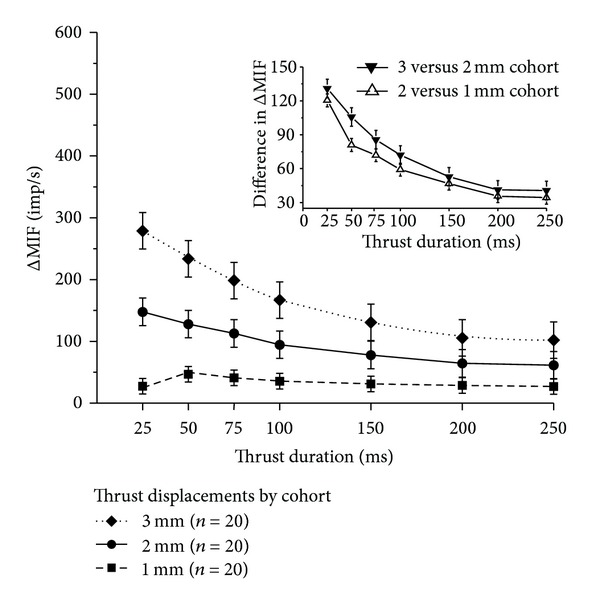
Average change in spindle discharge to 3 thrust displacements and 7 thrust durations applied under displacement control. The inset shows that lumbar muscle spindles responded more as thrust displacement increased from 2 to 3 mm than as it increased from 1 to 2 mm. Symbols represent average for the cohort. Error bars represent adjusted 95% confidence intervals. ΔMIF change in mean instantaneous frequency, imp/s = number of impulses per second. n = number of cats in the cohort.