
Figure 6.
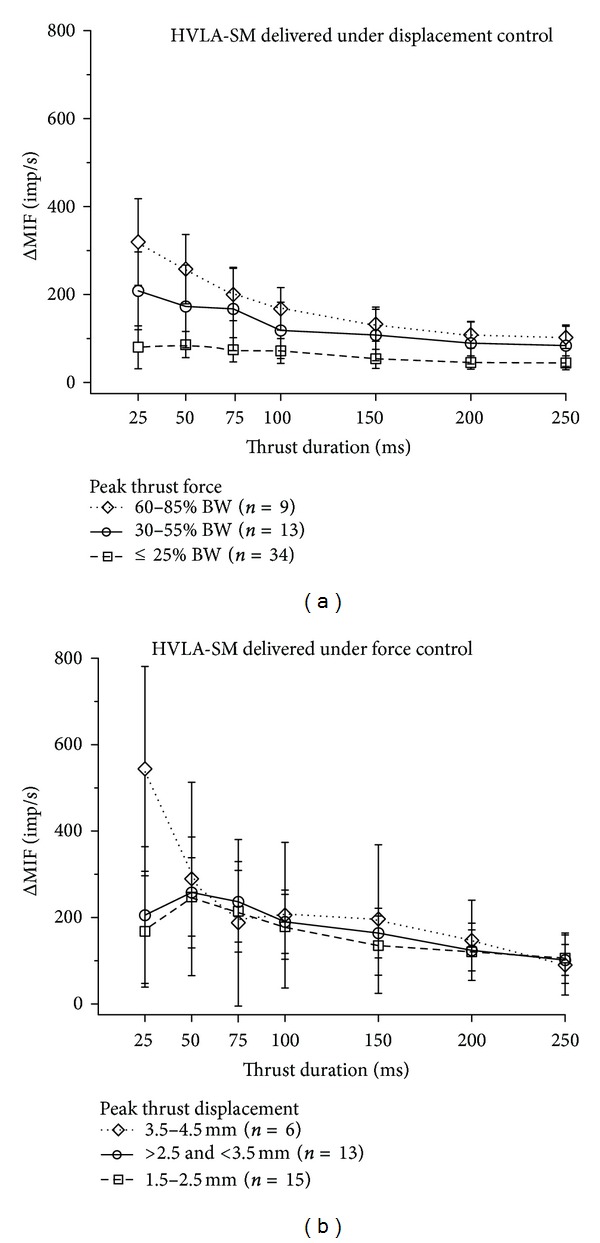
Regrouping of data shown in Figures 3 and 4 based upon (a) 3 ranges of thrust force that developed during displacement control of the HVLA-SM's delivery and (b) 3 ranges of thrust displacement that developed during force control of the HVLA-SM's. Symbols represent average for the cohort. Error bars represent adjusted 95% confidence intervals. Abbreviations identical to those in Figure 3.