
Figure 1.
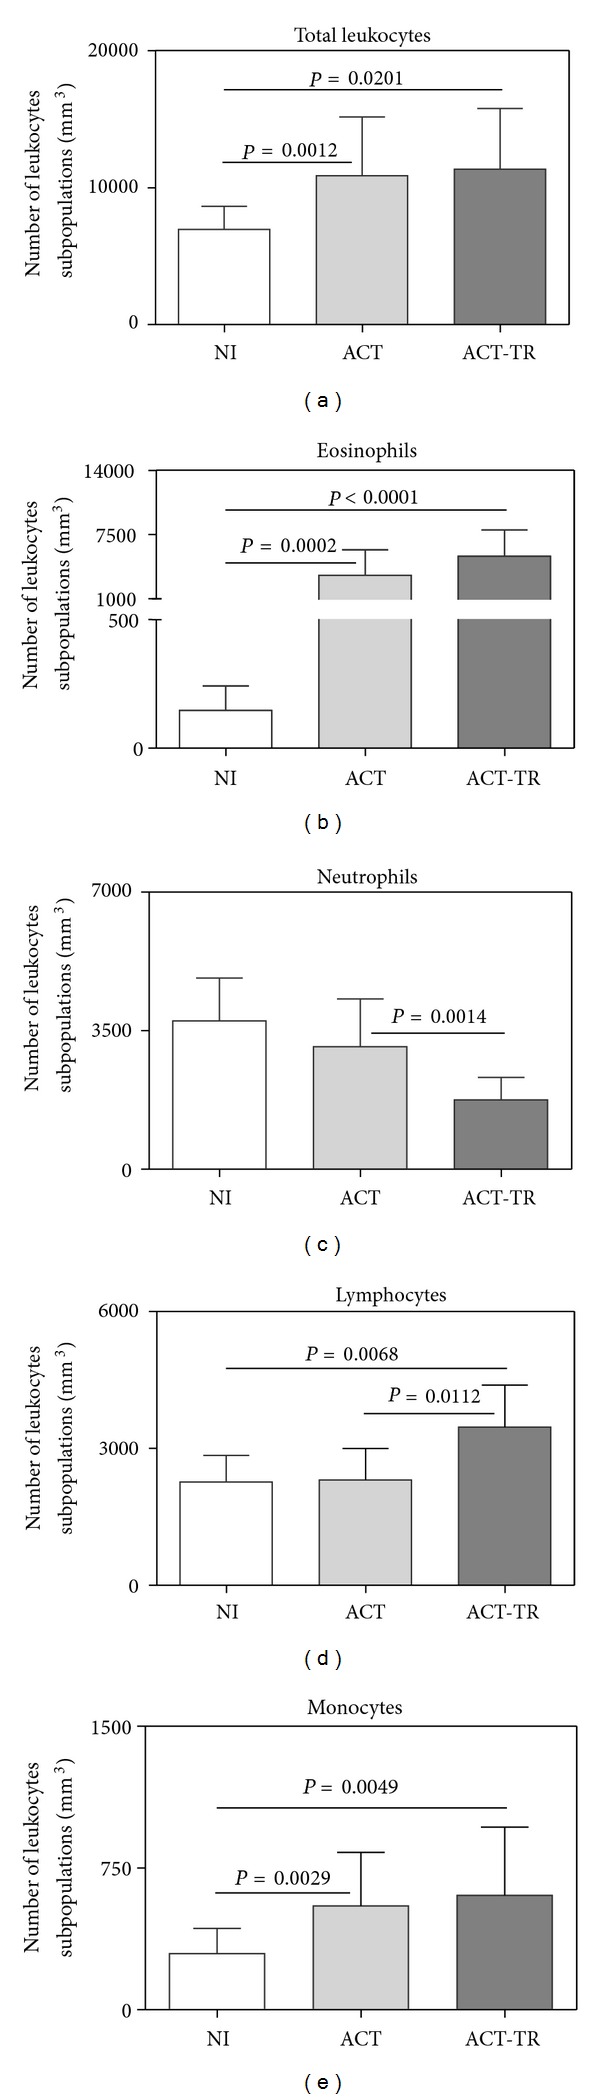
Analysis of hematological profile from patients with acute Schistosomiasis mansoni before (ACT, faint grey square = 21) and after praziquantel treatment (ACT-TR, grey square = 07) and noninfected individuals (NI, white square = 19). The results are shown in bar-plot format highlighting the mean counts of datasets/mm3 ± standard deviation. Statistically significant differences (connecting lines) observed between groups NI, ACT, and ACT-TR were considered at P < 0.05.