
Figure 3.
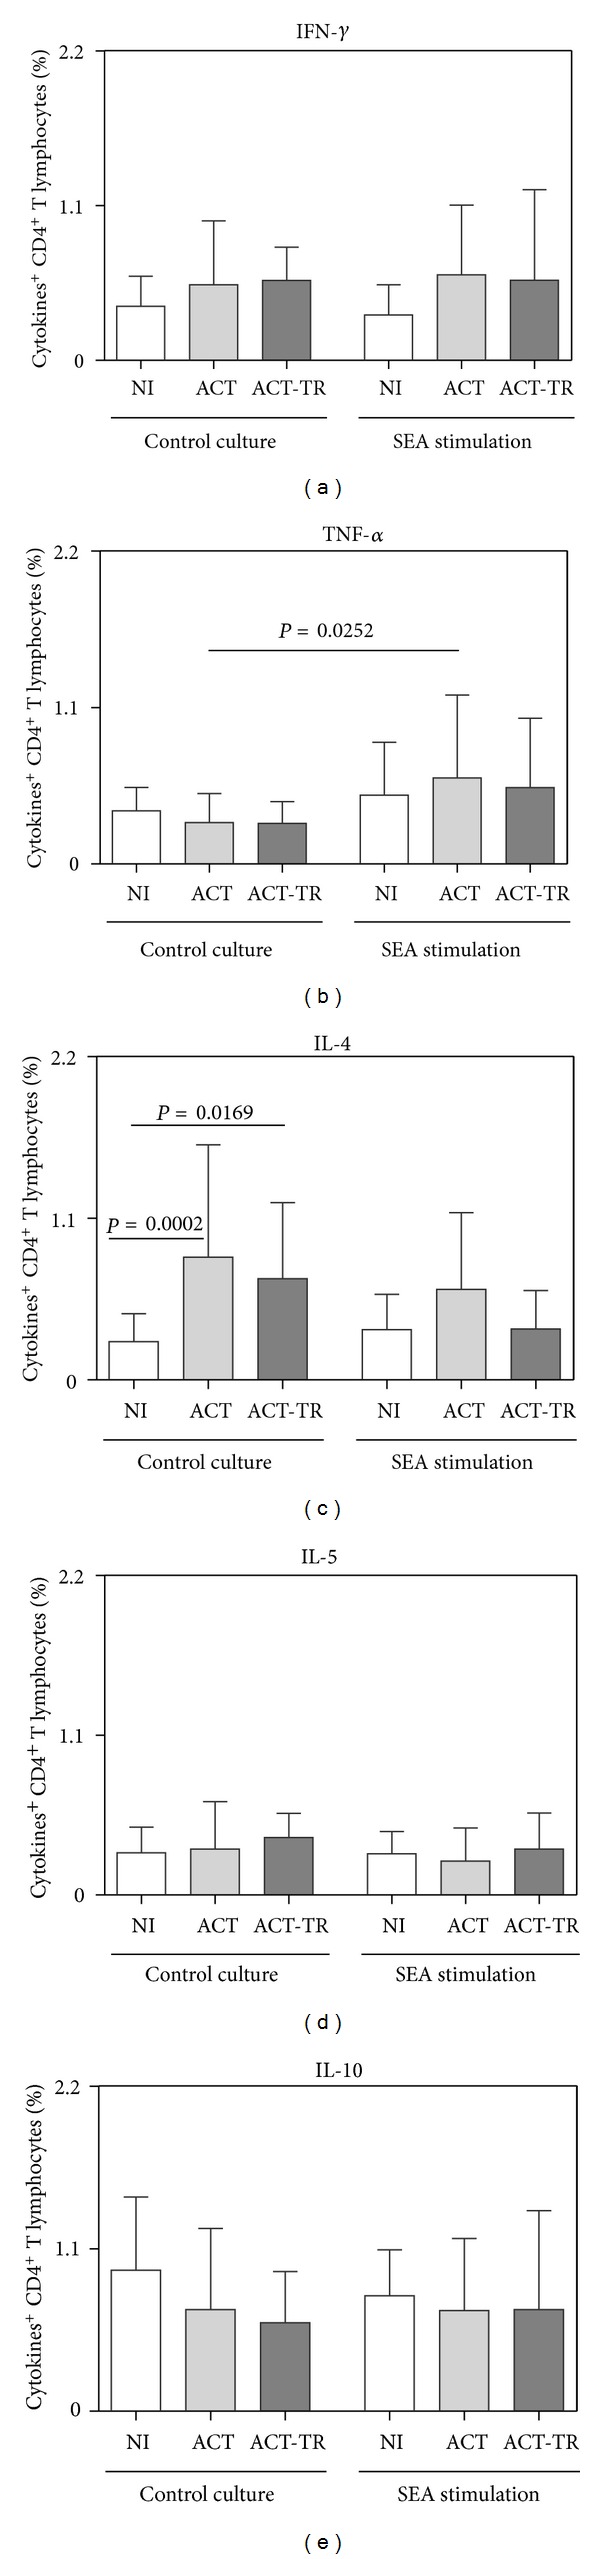
Cytokine pattern of circulating T CD4+-lymphocytes from patients with acute Schistosomiasis mansoni before (ACT, faint grey square = 21) and after praziquantel treatment (ACT-TR, grey square = 07) and noninfected individuals (NI, white square = 19), following short-term in vitro cultivation in the absence (control culture) or presence of SEA stimulation. The results are shown in bar-plot format highlighting the mean percentage of datasets ± standard deviation. Statistically significant differences (connecting lines) observed between groups NI, ACT, and ACT-TR were considered at P < 0.05.