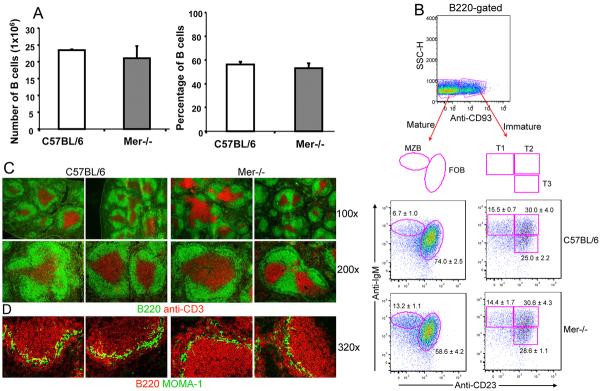
Figure 1. Primary development of B cells in the presence or absence of Mer.

Panel (A–B): Quantitative and four color flow cytometric analysis was performed on spleen cells obtained from B6 and Mer−/− mice after staining with B220, anti-CD93, anti-IgM and anti-CD23. (A) Total number of B cells (left panel) and the percentage of B220+ cells (right panel) are shown in C57BL/6 (open bar) and Mer−/− (shaded bar) sex matched 8–10 wk old mice. (B) The percentage of mature (B220+CD93neg) and immature (B220+CD93neg) B cells are shown in the top panel. Subdivision of mature and immature B cells into marginal zone (MZB), follicular (FOB), and transitional type 1 (T1), T2 and T3 populations are shown by oval and rectangular gates, respectively, in the lower panels. The percentage of each B cell population in the spleens of B6 (middle two panels) and Mer−/− (bottom two panels) mice is indicated next to each gate. (C) Spleen sections obtained from naïve mice of the indicated genotypes were stained with B220 (green), anti-CD3 (red) and images captured by fluorescence microscopy. Original magnification of images was 100× (upper row) and 200× (lower row). (D) Similar analysis described in the legend to Figure 1C was done in which spleen sections were stained with B220 (red) and MOMA-1 (green). Original magnification of images was 320×. All data are representative of at least three mice per group.
