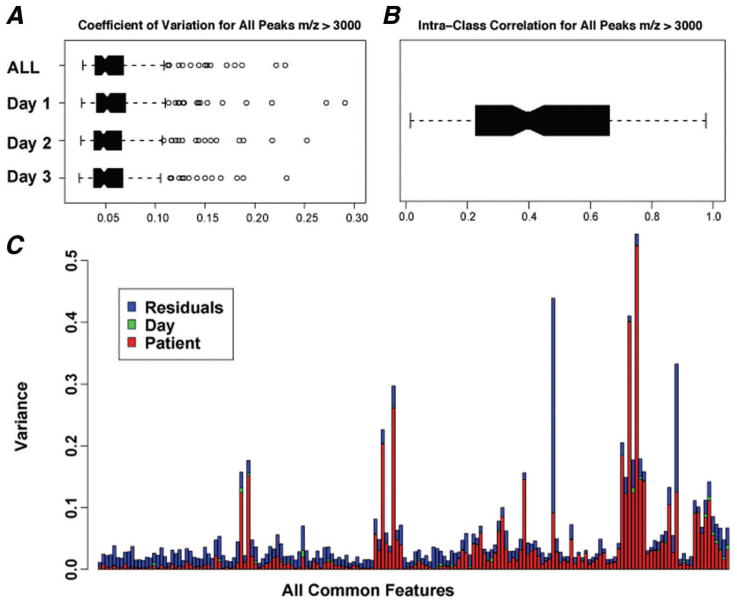
FIGURE 1.
Reproducibility analysis of the bevacizumab/erlotinib training data set. A, Coefficient of variation (CV) using 139 common peaks across all sera in the 3000 to 20,000 m/z range. The results show low and comparable CV across all days, suggesting highly reproducible spectra. B, Intraclass correlation coefficient (ICC), a measure of reliability, is 0.5192, suggesting a good agreement at all common peaks. C, A summary of observed patient, day, and residual variance (a measure of variability distribution), for the 139 common peaks.

