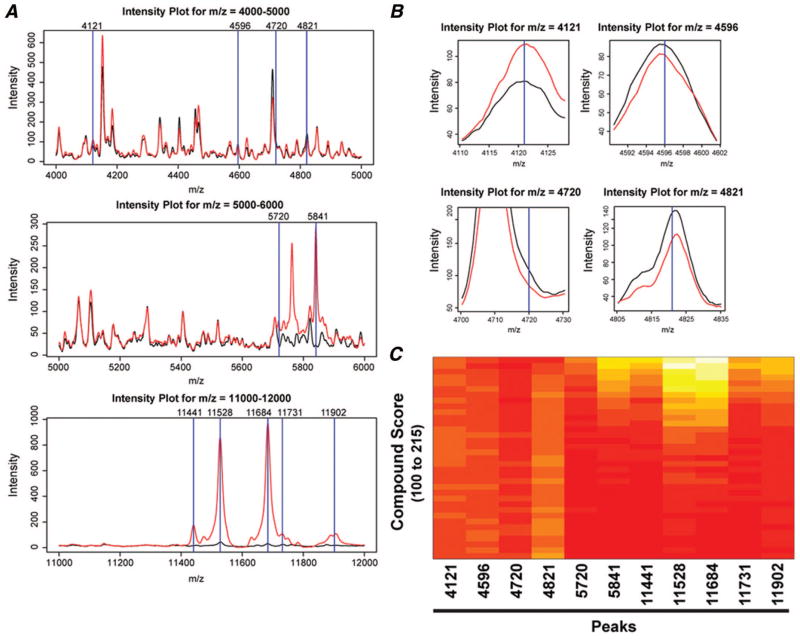
FIGURE 2.
The intensity plots comparing the mean spectra of samples from the group with high versus the group with low compound scores, respectively. A, Intensity plots for m/z regions 4000 to 5000, 5000 to 6000, and 11,000 to 12,000 demonstrating different intensities among 11 features (blue lines). The black line denotes mean intensity of peaks from patients with compound scores equal or less than the median. The red line represents mean intensity of peaks from patients whose compound scores were greater than the median. B, Magnification of intensity plots for features 4121, 4596, 4720, and 4821 showing a subtle difference in intensity between the mean spectrum with high and that with low compound score. C, A heatmap of the 11 peaks or features from the bevacizumab/erlotinib training data set, ranked according to compound score. The levels of peak intensity (features 4121, 5720, 5841, 11,441, 11,528, 11,684, 11,731, and 11,902) increase as compound scores increase, whereas peak intensities of features 4596, 4720, 4821 decrease.

