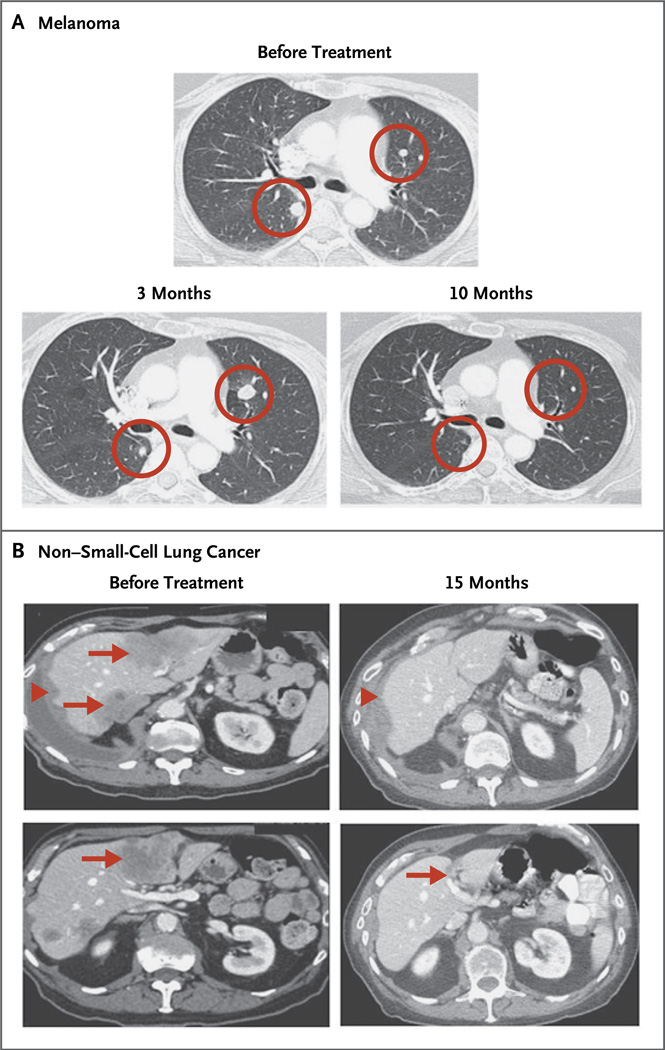
Figure 2. Computed Tomography after Receipt of Anti–PD-L1 Antibody.
Panel A shows a complete response in a patient with melanoma who received 3 mg of anti–PD-L1 antibody per kilogram. Circles indicate an initial increase in the size of pulmonary nodules at 6 weeks and 3 months, followed by complete regression at 10 months (i.e., an immune-related pattern of response). Panel B shows a partial response at 15 months in the liver (arrows) and right lung pleura (arrowheads) in a patient with non–small-cell lung cancer (nonsquamous subtype) who received 10 mg of anti–PD-L1 antibody per kilogram.

