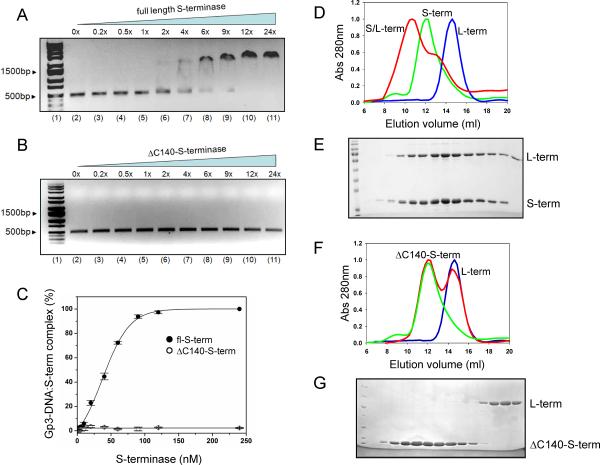
Figure 4. P22 S-terminase DNA-binding activity.
EMSA of fl-S-terminase (A) or ΔC140-S-terminase (B) binding to gp3-DNA. In both panels, lanes 2–11 show a titration of 0- to 24-fold equivalents of fl- and ΔC140-S-terminase incubated with the gp3-DNA and separated on a 1.5% agarose gel followed by ethidium bromide staining. (C) Quantification of EMSAs in (A,B) based on four independent repeats. The binding of fl-S-terminase (D) or ΔC140-S-terminase (F) to L-terminase was characterized by SEC on a Superose 12 column; elution peaks for S-terminase, L-terminase and the S/L-terminase complex are shown in green, blue and red, respectively. (E) and (G) show SDS-analysis of fractions eluted from gel filtration in panel (D) and (F), respectively.

