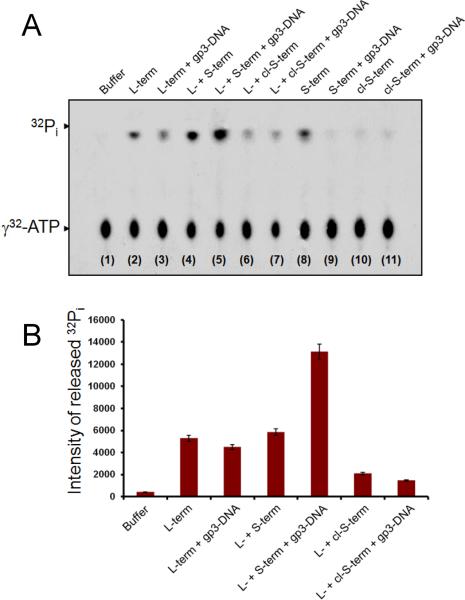
Figure 5. S-terminase activates the ATPase activity of L-terminase in the presence of gp3-DNA.
(A) ATPase assay resolved on PEI-TLC in the presence of different reactants and γ32-ATP. The position of γ32-ATP and 32Pi is indicated by arrows (B). Quantification of 32Pi released during the ATPase assay. The intensity of 32Pi released by L-terminase in the presence of S-terminase and gp3-DNA (lanes 4–5 in Figure 5A) was corrected by subtracting the intensity of 32Pi released in control reactions containing only S-terminase, with and without gp3-DNA (lanes 8–9 in Figure 5A). Error bars are calculated from averaging the intensity of 32Pi released over five independent experiments carried out under identical conditions. The average standard deviation is usually less than 3%.

