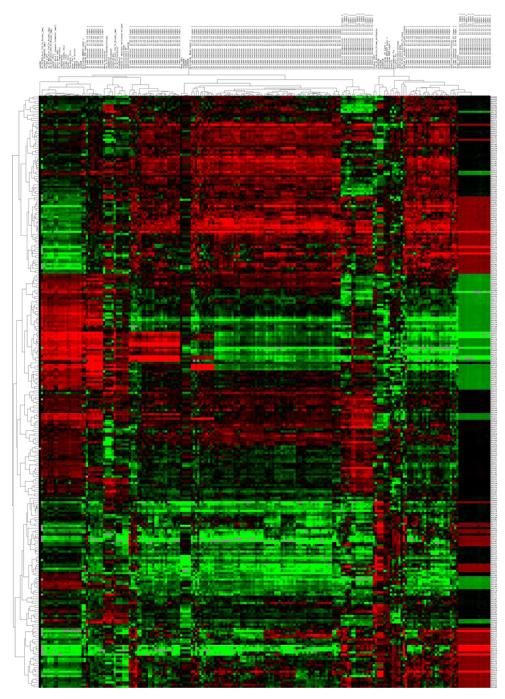
Figure 8.
Unsupervised hierarchical clustering of lung tumor image features extracted from CT images from 276 non-small cell lung cancer patients. Tumor segmentation for each CT image was performed in a semi-automated fashion. Quantitative imaging features were calculated using Definiens (Munchen, Germany) and represent many 2-dimensional and 3-dimensional characteristics of the tumor. Aspects such as tumor volume, shape and texture were represented. Each of the numerical imaging features was median-centered and all features were clustered using complete linkage, with correlation used as the similarity measure. The resulting heatmap is visualized using red to represent higher than median feature values, and green to represent lower than median feature values. Each row of the heatmap represents a specific imaging feature across patients and each column represents all features for a patient’s lung tumor from CT.

