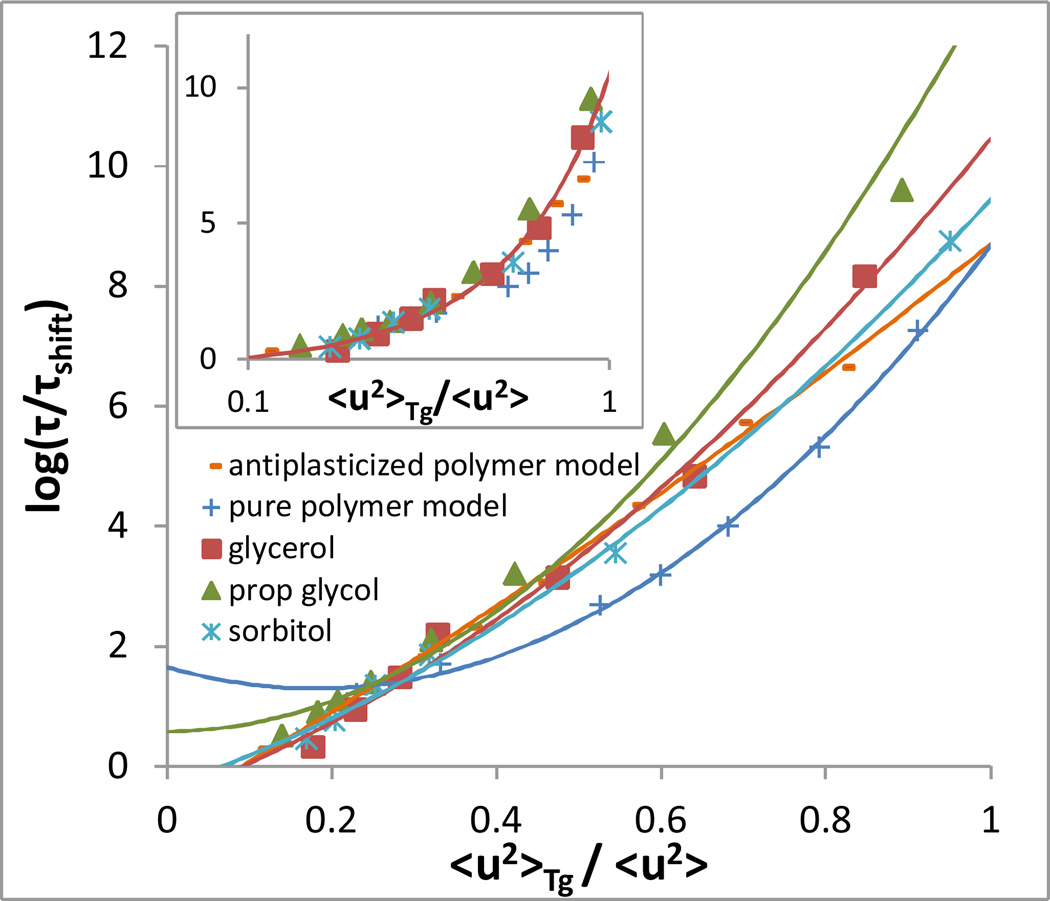
Figure 1.
Log relaxation time vs inverse Debye-Waller factor scaled by its value at Tg for the systems described in the text. The inset shows the same data plotted with a logarithmic x-axis, as in papers by Leporini and coworkers7–9. An arbitrary renormalization of relaxation time has been manually applied to each system to yield the best possible collapse, in the high temperature range, following the approach of Leporini and coworkers. This shift is equivalent to varying the value of τ0 in any of the models described in the text. Curves represent quadratic fits of the form given by Leporini et. al.

